Market Moving into Crash Mode

The market appears to be moving into crash mode or into a panic type intra day low that may occur either this Friday 3/18 or the Monday after the weekend 3/21. This could be a huge one day move and may even take the SPY to a gap fill near the 120 range.  The volume … Read more

sp500 Goes Into Panic Decline Today on Heavy Volume

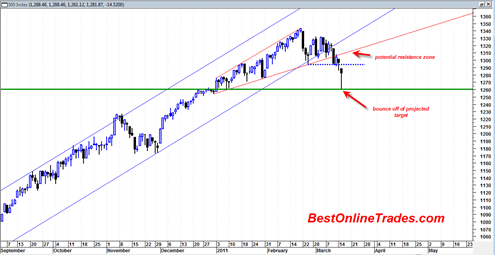
It looks like there is a strong probability we have created the first tradeable low in the sp500 today on this panic of the Japan earthquake and nuclear situation.  I wrote in a previous post that the sp500 was forming an important broadening wedge formation and that the ideal target for the drop is the 1260 to 1270 range which would be the beginning formation of the broadening wedge.  As it turns out this is almost exactly what happened.

Today had the flavor of a panic high emotion low with very heavy volume. 

The ARMS index today hit an intra day high of close to 12 which is an astounding amount of intra day fear and helps argue the case that we are near an important trading low.  I believe that is only the second time in history that the ARMS hit such a high level.

My understanding of the rising broadening wedge formation is that it does not necessarily have to be a major top, it can simply also be a corrective formation within an uptrend.  This is important because I still think it good to keep an open mind about the nature of the current correction.

Read more

Any Bounce Going Forward in sp500 Near Term Should be Shorted

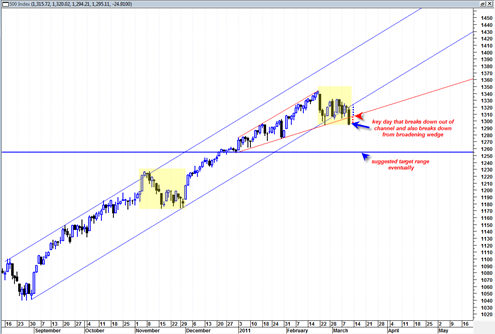
Today was a clear confirmation to me that we have switched from the massive bullish trend since late August 2010 to a beginning bearish trend.  In yesterday’s post I pointed out the double inside day 3 day price pattern in the sp500 and said it would lead to a huge move either up or down. Today it was clearly down, closed at the lows and also had more than enough volume to go with it.

I think we could get some type of upward bounce tomorrow on some positive consumer confidence numbers but then maybe a sell off near the close.

A bounce higher tomorrow could reach two possible levels.  One level corresponds with the underside of the broadening wedge formation I have been talking about now for quite some time.  The other level corresponds to the underside of the up channel we just broke down through.

My preferred choice is that we bounce to the underside of the broadening wedge and then get stuck there for a while and then fail at the end of day.

The much more painful upside bounce level would be back to the underside of the channel we just broke down through.  The reason why it would be more painful is because it would completely erase all of today’s short selling gains.

sp50020110310

So again the preferred scenario is for an upward retracement to the point indicated by the red arrow in the chart of the sp500 above. I would look for any rally to run into a brick wall near those levels and gauge the market carefully from there.

Read more

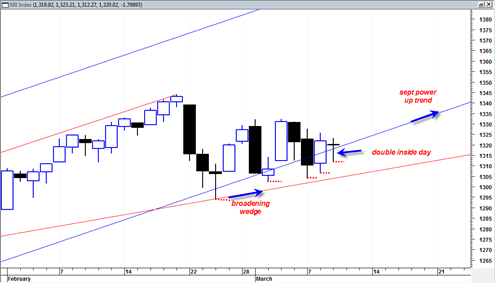
sp500 Prints a Double Inside Day Today

Today was a double inside day when we look at the last 3 candlestick bars.  Basically what it means is that the market is compressing into a triangle and a huge move is about to occur either up or down. After reviewing some charts, especially the financial stocks I am starting to get cold feet … Read more

sp500 Broadening Wedge Still Forming

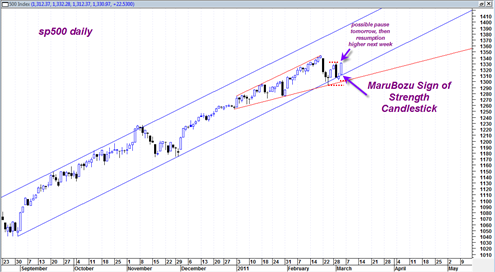
The Broadening wedge formation in the sp500 is still filling out its formation and in general I am viewing this as an eventual bearish resolution type pattern with the outside potential of it turning into a very bearish cascade type decline resolution.

Rising Broadening wedges are a very frustrating type formation because there exists an up trend and yet it is an uptrend defined by an expanding trading range which can be very difficult to identify in the early formation phase.

The weekly MACD and the weekly histogram on the sp500, the nasdaq and the DJIA all see to be confirming the idea that we are topping now and should get a bearish resolution out of this pattern.  I have to say that I will be utterly shocked to see a very strong (and quick) bullish resolution out of this pattern the next few weeks.  I have been shocked before, but I truly will be this time around if we see a bull resolution out of it.

There are a number of reasons why I think we will get extended bearish resolution soon:

  • The weekly MACD is almost at a negative crossover and curl over point.  Sometimes the actual crossover can lead to a bullish move, but the potential bearishness of the crossover is undeniable.  My chart work is showing that this bearish crossover should occur either by the end of this week or next week.  That should mean hard down prices soon.
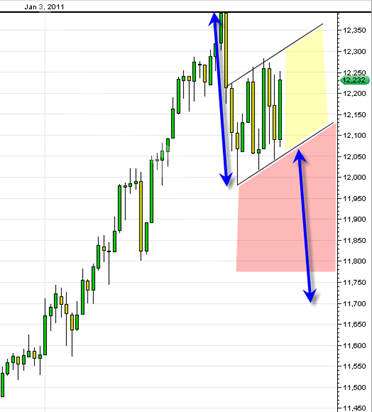
  • The DJIA appears to be trading in a violent trading range both up and down lately that defines a rising flag formation that has a clear measured down move.
  • I am seeing head and shoulder topping formations on most of the indices.
  • I am seeing 3 weekly hanging man candlesticks on the Nasdaq Composite which are still unconfirmed, however to see three of them in a row is a worrying sign.
  • The negative heavy volume versus light up volume relationships on the SPY ETF in the recent 3 weeks looks much more bearish than the consolidation that occurred in November 2010.  This time around I am seeing much more consistent heavy volume down moves that are more regular and heavy.  The up days volume is horrible.  This volume pattern suggests to me strongly that we are undergoing distribution currently (big money is moving out of the market).  Of course 200 point DJIA up days like we see today are a completely DISTRACTING smoke and mirrors situation that blinds those who don’t also look at the volume relationships.
  • If we eliminate all the points I just made above, then just the simple anecdotal point I mentioned in a previous post could be enough reason for us being at a top.  The anecdotal point I am referring to is the sub headline on CNBC a week ago that already quickly presumed in question form "on the next leg up will financials lead the way?”.
  • NYSE summation index is back in bearish trend mode.
  • High flyers such as NFLX on the monthly chart created a huge topping tail on the monthly candle and point to bullish exhaustion for some techs
  • AAPL also looks ready to start a bearish trend again.
  • The VIX volatility index has a bullish weekly trend and broke out of the long term down trend line.
  • The US Dollar so far has not busted below its long term 3 year up trend line and so far on the monthly candlestick is showing a March reversal hammer that could lead to bullish resolution for April.  If the inverse correlation with the sp500 is still valid then it supports the case of a big down move in stock market and big up move in the dollar index off of support.  Perhaps this would be related to the ending of QE and a tick up in rates to support the dollar?

Read more

An Interesting Tug of War Today in the sp500

Today seemed like a bi polar day in the markets.  The market was up down and all around trying to figure out what the jobs report means.  Had we closed at the lows today then we would have fully engulfed yesterday’s candlestick and potentially created a bearish scenario for next week.  We would also have started to create a similar looking situation to the April 2010 topping formation where we saw violent up rallies that were fully retraced down the next day.  That happened several times in end of April 2010 before the market fell apart.

This higher volatility and next day full retracement of a previous day’s surge higher could be a hint of more downside volatility to come.

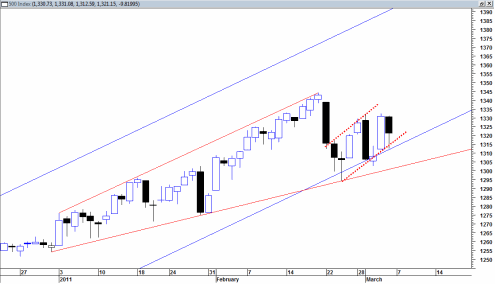
But still, when I look at the zoomed in price action of the sp500 I see that we are still holding the channel supporting line (bottom solid blue line) and today we tested it again and rejected it by end of day.  We are also still trading within the broadening wedge pattern.

So trading discipline and tape reading suggests that we are still in constructive form and could press higher next week.  We are still creating higher lows after the recent mini correction.

Read more

sp500 Confirms Channel Support Today

The sp500 today initiated a massive rally off of the lower boundary of the long term channel support in force since early September 2010.  I have to view this as confirmation that the bullish trend is healthy and alive. I indicated in yesterday’s post that the bears really had to take some action today to … Read more

Bears Need to Step up to the Plate Tomorrow

The sp500 today did not follow through on yesterday’s power down candlestick.  Instead we witnessed a type of stoppage action and the volume also dried up considerably compared to yesterday’s SPY ETF Volume. The sp500 is still trading within the somewhat large broadening wedge formation and continues to trade within this pattern. The bears still … Read more

sp500 Decline is For Real This Time

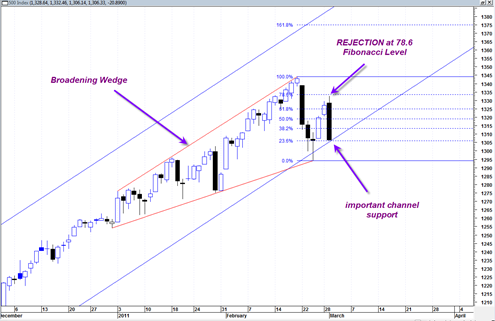
The sp500 today was rejected very severely at the 78.6 Fibonacci retracement level almost to the exact tick.  Also notably today we bearishly engulfed the previous two days price action and closed right at the lows.  Sometimes this type of action is ending action, but in this case it looks more to me like confirmation … Read more