BEHL Biocentric Energy Holdings Continues Bullish Trend

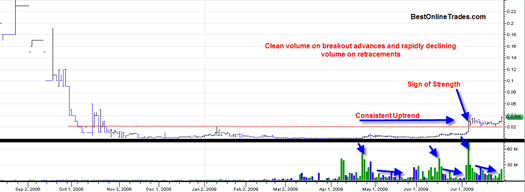
behl20090728 I want to do a quick refresher post here on BEHL.  BestOnlineTrades first mentioned BEHL on 7/23/2009 close to 3PM eastern time.  On that day the intraday low for BEHL was .021 and the intraday high was .0255.  It closed at .0255 .

Today BEHL closed at .0365, 43.14% higher than when it was mentioned on that day.

The price structure and performance so far still looks quite promising to me. I indicated before that I liked the clean volume advance which looked like heavy accumulation and the rapid decrease in volume on the retracements.  And as a bonus that volume and price action was coming off of a fairly long flat base of 7 to 8 months in duration.  This is important because many times it shows that a stock has entered a major new uptrend phase, or mini bull market if you will.

But the reality is that most penny stocks simply do not make it too far into their new mini bull markets.  They try and they fight to get higher but a lot of them just can’t get enough steam going and either the price advance is TOO LABORED, too slow or the retracements in between are too large and cause the advance to lose too much energy.  These things can kill the advance and cause the move to be a false one.

Read more

SP500 Index Starts a Retracement

sp50020090728 The SP500 looks like it wants to get a retracement going.  Currently I am thinking somewhere near the 950 level as I mentioned before being minor support and normal in the sense that often one will see price retrace right back to the breakout area.
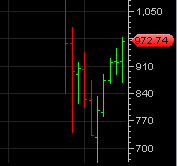
Also under consideration is the fact that we are only a few days away from the end of the month of July.  The little chart to the left shows monthly price bars on the SP500 index.  So the next opening price and initial price action for August will soon be printed on that chart.  It is possible, but unlikely in my opinion that the opening and continuation price for August will just easily continue at and above the 972 or higher level.  So instead I think we should see more of a retracement into the current July price bar for maybe the last few days of July and and then some days into August.  Then after that is complete a resumed move higher.

I am also noticing at least the possibility of a bit of a US dollar bounce upwards and that could stir some headwinds on the SP500 shorter term.

A modest price pullback during this time of year would not be extremely unusual.  We already know that the SP500 was able to make a valid break of the recent highs with adequate volume, so a retracement starting now is not the end of the world.

Looking at a price chart on the monthly scale has been very useful to me recently when you look at it in the context of what kind of range the next succeeding price bars will have.  It helps to quantify what the probabilities of the next price move is.

I should add also that if the SP500 were to continue upwards at the same rate as the last two weeks then we would quickly be close to SP500 level of 1100 within the next 2 weeks which seems highly unlikely, though not impossible.  So the upwards rate of change just got a bit ahead of us here.  So now I believe we will be in retracement mode. We shall see.

Read more

ETFC Etrade shows signs of New Uptrend

ETFC – Etrade Financial continues to show good signs of a new uptrend based on price structure and trading volume.  They recently reported another loss on July 22nd but CEO indicates that the recent money they raised will be enough to pull them out of their loan loss crisis.  In true market forward looking fashion, the market starts to mark ETFC up well in advance of any full resolution to their loan crisis.

etfc20090727b

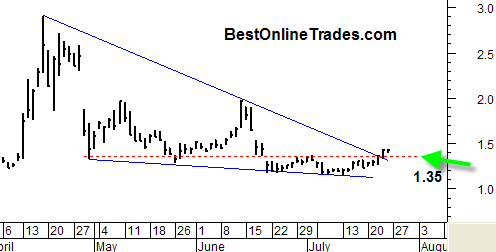
BestOnlineTrades added ETFC to the recommended list this morning very near the open at 1.47.  The stop is set at 1.38 but in this case that may need some fine tuning depending on if or how much of a pullback ETFC initiates this week or next.

The ideal buy price for ETFC was at 1.35.  But here at BestOnlineTrades we were a couple days late in spotting ETFC as a possible candidate.  If a 1.35 entry was taken than it would have allowed ideal stop placement just under that support area as depicted by the red dashed line.

Read more

ETFC Etrade Financial Possible Buy Setup

etfc20090727 BestOnlineTrades.com has spotted ETRADE corp ETFC as a possible upside trade this coming week, possible as soon as Monday morning (this morning).
Sometimes it amazes me how certain patterns and setups come to my attention.  It just so happens that I had ETFC stored on my computer’s archives of charts and had not looked at it in while.  But I can tell you that when I did look at it I was pleased what I saw.

I have found that finding new setups is not always a matter of just running a technical scan or looking at a top 10 list.  Yes, there are scores of filters and pattern analyzers out there, but nothing, I tell you nothing replaces the simple act of manually scanning through a bunch of charts with your EYES and using your mind as the filter.

That is what I did this weekend and so far I am pleased with what I see in ETFC.

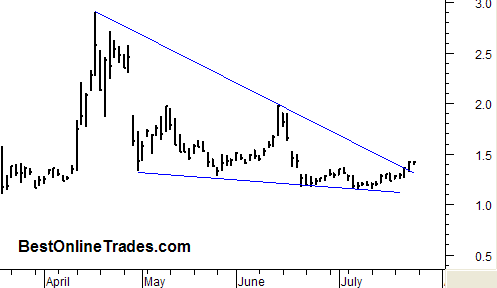
ETFC appears to have a somewhat large pattern formation that resembles a large falling wedge.  Within the past few days ETFC has elected to peek its head above water and slightly pierce the down trendline that makes up the top portion of the wedge.  The volume on the very recent move was very robust.  To me it suggests ETFC may want to get a run going soon, especially with the broad market wind at its back.

Looking at the chart, I see a possible upside here of the top portion of the wedge.

Read more

IDOI IDO Home Land Security Stock Still Constructive

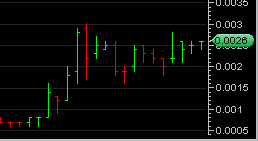
idoi20090724

IDOI, the pinksheet penny stock that you have already heard me mention several other times still has a constructive look to it.

I mentioned earlier in the week that I wanted to see it move by either yesterday or today. Well so far that has not happened and I am willing to give IDOI a little bit more benefit of the doubt.  It is getting some late day hits at the ask here on this slow Friday.

The reason why I am not giving up on IDOI yet is because instead of price continuing a slow and slopping downtrend that it was on track to do, it has instead popped its head up with decent volume and held up above the mid .002’s range quite well so far.

Of course all of this could change in a New York minute on Monday morning, but as of this writing I have to say the behavior of it is quite admirable.  I don’t know if I am going to keep a formal list of recommendations for these sub penny stocks and penny stocks that I cover.  Perhaps I will keep a more informal list just for record keeping.  So basically that means that I don’t think I will keep publishing an updated list.  However I will occasionally publish a list based on what I have talked about and what it ended up doing.

So informally lets put IDOI on the list with an entry of .0025.  I think that is reasonable since I have been talking about it for about a weeks time now.

I think what I will do is create a summary page of all recommended penny stocks and sub penny stocks.  It will not be updated in real time, although I will try to, but that way I don’t have to keep posting the list within the article postings.

Read more

UNG Natural Gas ETF Reverses down hard

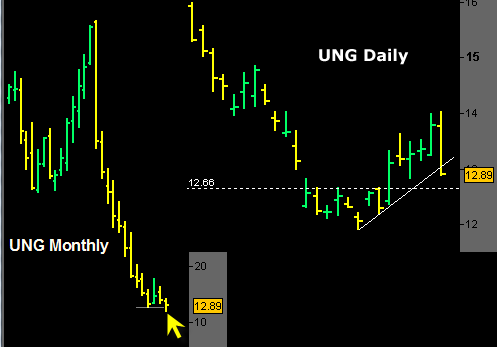
UNG2

Ok well I am a bit disappointed in the way UNG played out. UNG stopped out today right at the close at 12.90 for a loss of 7.06%.  I suppose it is better to be stopped out right at the close of the day than to sit on something like UNG overnight.  This was a violent in your face reversal. Wow.  The chart above shows a clear birds eye view of what is going on with UNG.

The left side of the chart is monthly price bars.  You do not have to know much about technical analysis to know that this chart depicts a crashing price and severe price weakness. But the interesting part is the most recent monthly price bar that has a little yellow arrow pointing at it.

Read more

BEHL Biocentric Energy Holdings Penny Stock Worth Watching

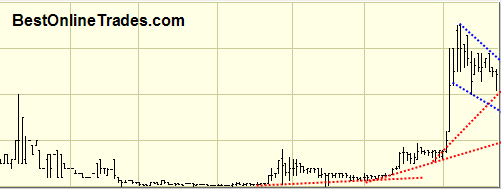
behl20090723

BEHL, a penny stock that trades on the pinksheets is worth watching to me because it has shown 3 signs of strength already since a few months ago and now is in a consolidation pattern that will either be a falling wedge or just a sideways channel.

I like that advance that BEHL has had since a few months ago.  The quality of the volume on the advances and the rapid decline in volume on the consolidations looks good to me.  A lot of times on penny stocks I tend to see heavy volume on the advances but then also excessive volume on the consolidations.  In my experience that has more often than not been a troubling sign.  But BEHL has not shown that and right now price is holding within the range of .02 to .035. 

So .035 is the top of the range.  I do not know how much longer this consolidation will last, but when either of those two blue dotted down trending lines on the chart above are violated, it will be the first sign that change is at hand.  I think there is an outside chance BEHL could do a swing low to .015 before the uptrend resumes, but I could be wrong.

Read more