Direxion Daily Financial Bear 3X Shares Look Very Good To Me

FAZ20091218

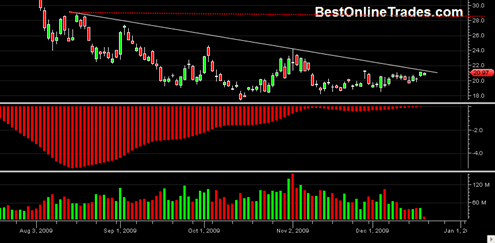
The FAZ Triple Inverse Financial Bear ETF looks extremely attractive to me right now based on everything I am seeing in the market.  The UNG performed as expected and is now getting to be a tired trade already and I suspect it will pull back some before building higher down the road.

But now the FAZ has flashed all sorts of buy setups and looks very good to me going into next week and end of year and early January.  I think we could see FAZ blast higher into the high 20’s range during the next 1 month time frame.

As I indicated in a previous post, the WEEKLY MACD has now turned down on the SPY and the SP500 index.  That means that the market will have weekly bearish headwinds going into next week.

Read more

SPY ETF Shows some Possible Ominous Bearish CandleStick Patterns

SPY200910172009

There are only about 8 real trading days left until the end of the year if you exclude the days around Christmas.  So that means about 8 trading days to create the final YEARLY price bar close and then start the next one for 2010.

The market has powered up so fast and so persistently in 2009 that one would think people would take at least a few points of profit and capital gains.  For us to close the 2009 yearly price bar only a couple points from the yearly high seems improbable.  Just like on a daily price bar right before 4PM you see day traders exiting, I think we could see similar type price behavior going into end of this year.

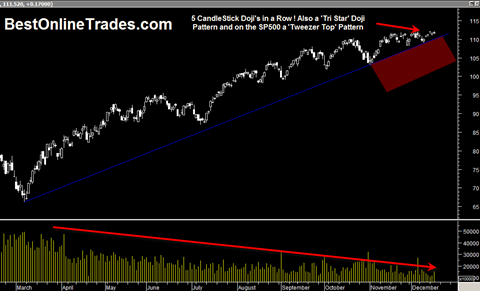
In addition I should also tell you that I have noticed some OMINOUSLY bearish looking candlestick formations in recent days on the SPY ETF and DIA ETF and also the SP500.

Read more

A 2 Year Correction for the Dow Jones Industrial Average ?

Thomas Bulkowski of the pattern site thinks the DJIA could be close to entering a 2 year correction starting pretty soon.  It is a nice post and lays out a few arguments why this may be the case.  After that he says the market could take a shot at the old highs.

In general I agree with him. We are getting close to the time for an extended correction.  Whether or not it will be two years long is unknown to me.  I was thinking earlier that it could be maybe 6 to 8 months long.  Either way a sideways to down correction like that would go a long way towards working off the overbought condition of the market and help build cause for the next move.

In other news I am keeping an eye on SQNM Sequenom.  It appears to have a nice ascending triangle and might get some kind of run going next week.  But on the other hand looking at the history of the stock the ascending triangles have not proven all that reliable and it is worth noting that SQNM is a biotech stock and has shown some very wild and scattered price action in recent years. 

Read more

Larry Pesavento Says the Market Goes Down Big Starting Next Week

Larry P, a superb trader who uses precise Fibonacci pattern analysis has been talking about the market being at an important top starting end of this week and beginning next week.

Larry P is also the one who made one of the greatest market calls I have ever seen.  During the October 2008 period he precisely called the worse declining portion of the ‘crash’ at that time.  I believe it was October 6th to October 10th, 2008.   Larry P is also heavily into Astro Trading and uses precise planetary alignments to pinpoint turning points and continuation patterns in the market.

The time frame of October 6th to 10th 2008 was a similar astro configuration to the one that existed in 1881 during the banking panic at that time.  So the planetary aspect that he was talking about was almost the same and existed over that period of 4 trading days.

Those 4 trading days led to huge price destruction and volatility during 2008 and the rest they say is history.

When I look at the SP500 I can see the possibility of a break down coming soon.   But I have said before and I will say it again… We need to break down under 1012 to 1014 as a first sign that we may be heading into a more severe correction.  When and if a correction starts it may happen very quickly to start it off as a big sign of weakness. 

Read more

I Can See the Future and it Looks Like the 1974 S&P500

1974monthlysp500

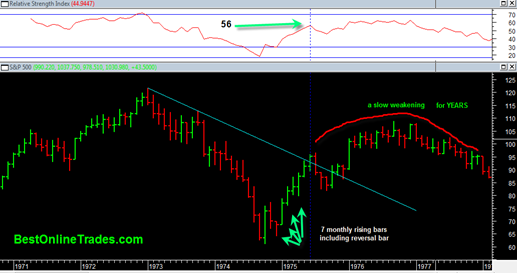
I don’t have a crystal ball that tells me what is in store for the future.  But the closest thing to a crystal ball that I have found so far is the 1974 time period of the S&P500.  The entire structure of the market during the time frame of 1968 to 1982 has given me a lot of good perspective and understanding about our current market and has helped to give me great clues and better confidence about where our current S&P500 may be headed in the future.

Now you may be asking yourself, what on earth does 1974 have to do with today ? Nothing actually.  But what I have found over the years is that sometimes past market movements tend to rhyme and show similar structure and trend development.

Read more

What I saw in the Broad Market Today: Absolutely Nothing

quotes 

Watching paint dry.  That is probably the best way to describe today’s action.  Up a little and then down a little and by the end of the day about dead even.

I am thinking that the next 2 weeks after this week ends are going to be flat to sideways.  I just do not see any major  market moves happening as far as the indices are concerned.

There still exists this shorter term possible bearish divergence in the SP500, but so far that has not led to any significant price destruction and the market may once again evade this bearish divergence if the SP500 can hold above 1014 the next couple of weeks.

There are three days left in the month of August and so the market has to make a decision by Monday how the August monthly price bar will look.  If it closes near where we are now then it could bode well for September.  But if by some miracle the SP500 starts to break down badly the next 3 days and slices down through 1014 very fast then it might be saying the first week of September could be hard down.

Read more

GRRF China GrenTech Corporation May Fill the Gap then Find Trendline Support

grrf20090825

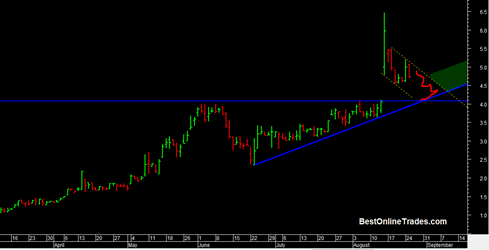
GRRF had a huge upward breakout spike in early August on some good earnings numbers.  Since that price spike the price of GRRF has been trending down within a steep down trend channel denoted by the yellow dotted lines (click on chart to see full size).

Right now I am thinking that GRRF is going to retrace this huge move and attempt to fill the large opening breakout gap and maybe come down into the low 4 range.

If it can fill this gap and hold support at the 4.10 range then I think GRRF may have a shot at resuming the uptrend and get a test going of the high volume swing high that created the gap.

GRRF should be able to fill this channel and make a decision no later than September 8th, 2009.  But I am going to have to watch price and see how it behaves when and if it is able to get into the low 4 range.

Read more

HBAN Huntington Bancshares is Nearing a Decision Point

hban20090825

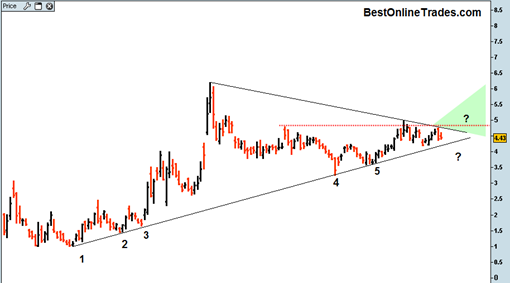
HBAN is nearing a decision point after a somewhat lengthy uptrend since March of this year and a few intermittent spike rallies.  HBAN has a somewhat similar setup to the FITB setup that I had written about in the past.

HBAN has been consolidating between roughly the 3.5 and 5 level for several months now and has already touched the bottom up trendline 5 times giving it good significance.

I cannot speak as to whether HBAN will be able to get an upside move off of this structure into the green shaded area.  Typically the market in general is vulnerable this time of year to some downside shakeouts.  But so far the broad market is holding up like a champ.  The retracements have been intraday retracement and not significant corrections.

Read more