SP500 creates high volume candlestick continuation DOJI Today

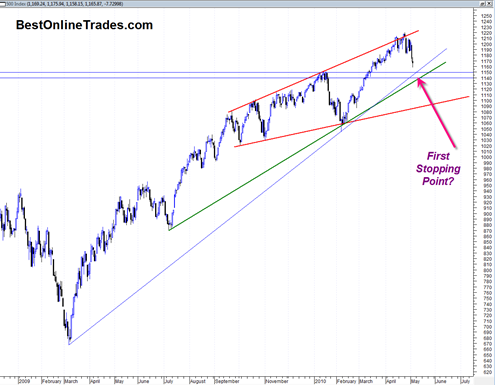
I think today is simply a mid point type move of the first leg of this correction.  It just does not feel like the bottom yet.  If we had a high volume reversal hammer today then I might say that we are ready for a nice big bounce topside.

Instead we got an indecision doji candlestick which was also on almost the same volume as yesterday.  That tells me that the market is simply digesting the recent minor support area and while it may go sideways or slightly up for a day or two, I expect soon thereafter another big body blow to the downside to create a mini exhaustion type move.

After reviewing my charts I can clearly see that 1140 on the Sp500 should be the start of a violent bounce to the upside.  I am hoping we print that level either tomorrow or Friday as a means to close out shorts. I have not decided yet whether it will be worth it to play the upside bounce but for now these are the guideposts I am looking at.

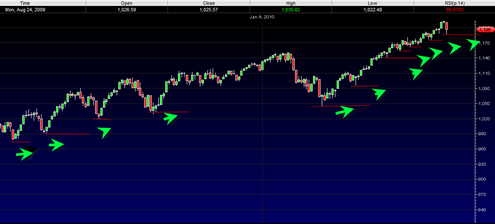
Assuming I am correct that we get a good bounce going from 1140 then I would expect the peak of the next reaction rally to serve as a pivot point to trade back down to the bottom side of the ascending broadening wedge (the solid red lines in the chart below).

Read more

Hanmi Financial Corp may do a continuation breakout soon

HAFC has recently broken out north out of a quite large ascending triangle formation and has done so with a wide price spread and heavy volume, confirming it.  The volume was slightly less than the highest volume swing in the previous range and so that is somewhat of a concern.  However at least for now … Read more

Prediction for the Week that Begins 4/19/2010

I could be wrong about this, but I predict that we end this week higher in the broad market.  I also predict that Goldman Sachs will end higher this week than where it closed last Friday.

My guess is that investors will come to their senses when the Goldman earnings come out Tuesday and realize that this company is almost literally a non stop printing ATM machine and that any liabilities they have to pay out will be simply that, cold hard cash and a tiny fraction of what this company can earn in the real world.

In addition to that there are plenty of other earnings reports to chew on this week from a good portion of the SP500 index and the DJIA as well.

So it will be interesting to see how it all shakes out.  But for now I think higher by the end of the week or at the very least some decent base building before another move higher.

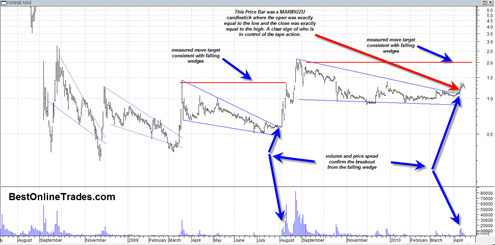
Ambac Financial Group, Inc. ABK may trend lower for most of this week and I would like to see it find support near the 1.00 range where there was an extremely high volume gap.  A more towards the 1.00 range also comes near the 78.6% retracement level and is an area where it has found support on previous mega spikes.

Read more

Market Tops are not Made in One Day but Market Bottoms Are

Today is another interesting day on Wall Street.  The Arms index hit a high today of close to 3.65 and tells me that today’s decline is most probably a one day oversold type event.  The market was very clearly in heavily overbought territory and very overdue for some type of pullback.  And so when any market gets in such a severe overbought level the smallest piece of news can be enough to get a big correction going.

How we close today will still be important as a setup going into next week.  If we close near the lows today then it could be a sign that next week will see some downside follow through.  On the other hand a decent end of day rally today may set the stage for a bounce next week to work off this oversold situation right now.

It is possible that this is a more significant top, but we will probably need another attempt at the highs for better confirmation.  So far the SP500 is still trading in a higher highs and higher lows type situation and until that changes I give the benefit of the doubt to the bulls.

Read more

This could be a very important Market Timing Chart and Signal on the QQQQ

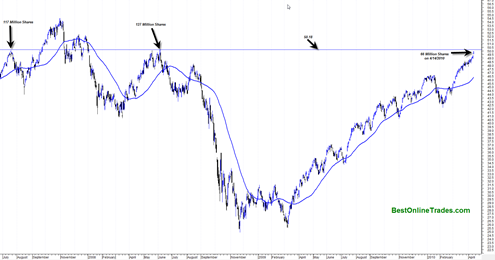
I just loaded up a longer term chart of the QQQQ Nasdaq tracking ETF (PowerShares QQQ Trust, Series 1) and I found a couple of potentially important clues.  The clue has to do with the current level the QQQQ is at right now and where it is situated relative to two other very important peaks.  It also has to do with the volume level at those peaks and the current volume at present day.

Nine times out of ten (my own approximation) whenever you have a stock or index reach a previous key peak level in the market, there is usually some type of retracement for the simple reason that previous holders want to get their money back.  Another reason is because technicians are also watching these levels and use it as an excuse to sell.  And a final reason is the quality of the volume test because in volume analysis you need volume that is within 3% or greater of the previous highs volume for there to be an eventual successful breakout from that level.

The chart of the QQQQ as shown below indicates that it is only .54% away from testing a very key previous resistance level both in terms of price and volume.

qqqq20100414

Basically we are within ‘inches’ of this key level.  The key level on the QQQQ is 50.18.  This is a key level because you can see from the chart the two previous key price peaks were generated at this level and they were relatively sharp peaks.

Read more

China Agritech Inc at a Moment of Truth

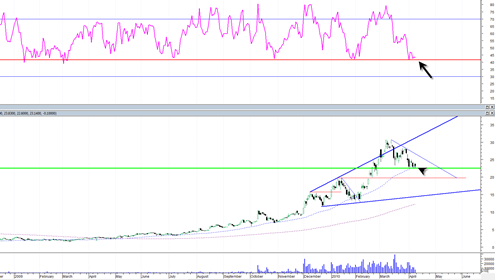
China Agritech Inc. is right now from a technical analysis standpoint at a moment of truth in my opinion.  CAGC in the past has consistently held the support of its 50 day moving average and also the 42 RSI level (Relative Strength Index).

The 42 RSI level has repeatedly served as a base for this stock going all the way back to the start of 2009.  This means that we should expect the 42 RSI level to hold for China Agritech Inc. to keep its longer term bull run intact. 

If the 42 RSI level does not hold then what it says to me is that the longer term ‘easy’ uptrend is broken and CAGC may go into a more complex longer duration correction.

In the short term the stock is suffering from a small descending triangle formation.  These formations can lead to a break down in price but they also have a habit of failing quite often as well.  So if we do get a breakdown out of the small triangle and move below the 42 RSI level then it would seem more corrective action is on its way.

Previously I had drawn a large broadening wedge type pattern on CAGC and if the pattern is accurate then it suggests there is at least the possibility of CAGC going back down to the bottom of the wedge eventually near the 17 level.  That may seem like an unusually large move, but this stock is famous for swinging high but just as easily swinging low when money gets scared.  The float is small and the volatility is high.

Anyway here is the chart I have for CAGC which shows the broadening wedge as well as the critical 42 RSI level indicated by the solid red horizontal line in the indicator portion of the chart.

Read more

Freddie Mac May Move in Sympathy with AIG soon

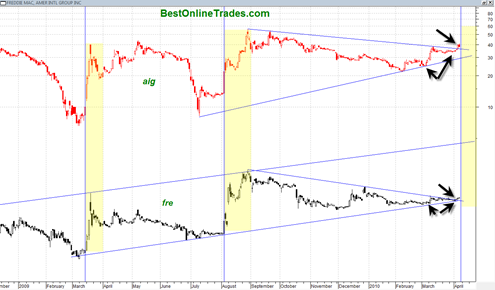
Freddie Mac (FRE) currently price at 1.34 may move higher in sympathy with AIG American International Group, Inc. soon.  FRE continues to be dogged by the housing depression and the government involvement or lack thereof.

However the economy is on the mend and there are some bright spots appear that may lift the shares of Freddie Mac  FRE soon. 

If you put the share prices of AIG and FRE right on top of each other you will see a general tendency towards symmetry on some of the big moves each stock has made over the last year.  There appears to be a slight lag effect in the movement of FRE relative to AIG.

Significantly, AIG has just recently broken out north from a very long term downward sloping resistance line and what also appears to be a very large triangle formation.  Similarly Freddie Mac  FRE has also just done the same thing although it has not really had a breakout type move out of this triangle yet.  To accomplish that it will need to trade and move over the 1.38 level which it may do early next week.

Read more

Dow Jones Industrial Average and SP500 show Hanging Man Candlestick

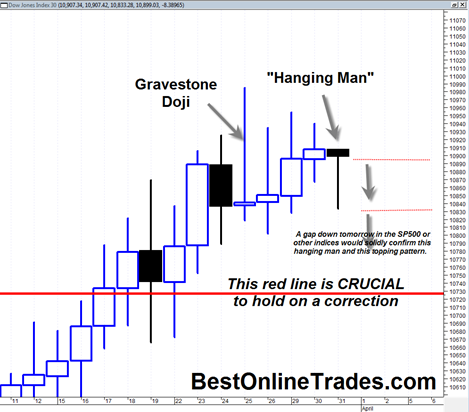
Breaking news development… The Dow Jones Industrial Average as well as the SP500 Index are currently as the time of this posting showing another potential bearish implication candlestick formation. The formation is the bearish hanging man candlestick.  This candlestick looks like a bullish hammer, has a small body shape and a tail that is at … Read more

Las Vegas Sands Corp. (LVS) is behaving like a Champ

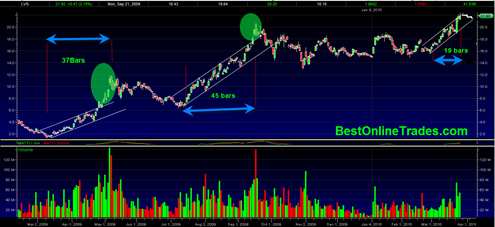
Marina_Bay_Sands_model_1 Las Vegas Sands Corp. (LVS) which I first mentioned as a possible breakout candidate here is behaving extremely well and right now is one of my favorite stock charts to focus on.

There are a number of reasons why LVS is worth keeping as a permanent watchlist stock for short term and long term tracking.

  1. Liquidity -  Las Vegas Sands Corp. is an extremely liquid stock and it moves nicely and seems to trend smoothly, not to mention the fact that it has a very clean chart from a short term, and long term perspective.
  2. Smooth Trending – I already said that, but I say it again because it is a great thing to have in any stock.  In fact if you did not tell me the stock symbol LVS before looking at the LVS chart, I would almost think it was a currency price chart as they also tend to move in more reliable trends.
  3. Options Liquidity – It has heavy options volume and plenty of liquidity in that department as well
  4. Its Cheap! – Relatively speaking LVS is still a lower priced stock and can still make some big moves. 
  5. It is a nice way to play the contraction and expansion of the economy as discretionary income levels contract or expand.  Got a little extra cash? Well then of course! Lets go blow it all off at the casino and see if we can win big!
  6. The Marina Bay Sands Casino in Singapore (pictured above) is scheduled to have its grand opening on April 27, 2010 after Las Vegas Sands Corp invested 3.895 billion dollars on it.
  7. It is a proven business and not a China Stock that is just starting operations an unproven.  Don’t get me wrong, I like all the little China Stocks, but many of them recently have plunged 30% in a few days time because of ‘accounting problems’ and other crazy reasons.  China Stocks can move big but a lot of them are still unproven business models and still highly speculative.
  8. They have a ‘sky garden’ on top of the Marina Bay Sands Corp Casino! Man would I like to hang out in that park on top of those three large buildings! Totally AWESOME 🙂 If there ever was a place to take a woman out on a ‘first date’ that would be it !

Read more

Kicking Myself for Missing the CAGC China Agritech Inc Put Option Trade

I really hate it when this happens.  I a couple days ago I wrote about the rare bearish tri star candlestick formation that had formed in CAGC after the enormous 130% + percent run up in only 1 months time frame.  After I wrote about it, I took a little bit of time to see what the March Put Options were doing on CAGC.  I was eyeing the March 25 out of the money put on CAGC which at the time was trading somewhere near .20 a contract.puts

So then I was thinking to myself how great a potential short term trade this would be in CAGC if it could somehow get to 25 or at least close to 25.  But then I started doubting the trade since it only had till the end of this week till expiration and I feared that the bearish tri star would not evolve into a bearish follow through soon enough.  And I really thought it would be a long shot for CAGC to get all the way to 25 with only a few days remaining until expiration.  Also in the back of my mind was the persistent resiliency of CAGC and its ability to hold up strong.

In the final analysis my little fears and doubts and failure to pull the trigger on this trade (ie. actually taking the trade) was a big mistake because it ‘could have’ led to a 400% to 800% profit in only 2 or 3 days !!!

Read more