SPY does a Bullish Spring of the May 6 2010 Mini Crash Swing Low

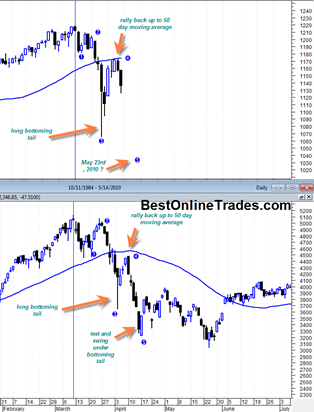
The SPDR S&P 500 ETF today accomplished a bullish spring of the May 6, 2010 mini crash swing low during the last 2 hours of trading today.  A bullish spring is when volume is not sufficiently heavy enough relative to previous swings and closing price is above those previous swings.

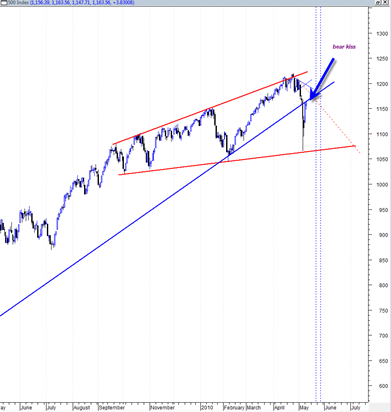
It was a close call today because the way the market was set up (including macd histogram, RSI and some other indicators) it really needed to get a good reversal going again otherwise it would have put the market at risk of a very severe plunge below May 6, 2010 support.  It just goes to show how the market is capable of putting everything on the line with only a few hours left to finally give the reversal signal.  The action today had the flavor of capitulation and leaves me much more confident that a true reversal is at hand.  How high the bounce is remains an open question however.

Also helping the bounce case is the US Dollar Index.  It looks like it double topped today on the daily chart and should get some type of move back down to its own 50 day moving average.  Perhaps that will support equities for the next 5 to 10 trading days.

Read more

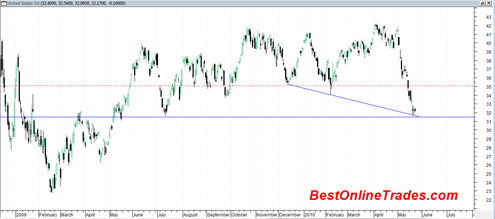
I just went long the United States Oil Fund LP ETF USO

Going long the United States Oil Fund LP (ETF) USO or the ProShares Trust ProShares Ultra DJ-UBS Crude Oil UCO ETF may be one of the most attractive trades I have seen in a long time.  It looks like it is an outstanding contrary type trade. I already mentioned that I am expecting a bounce … Read more

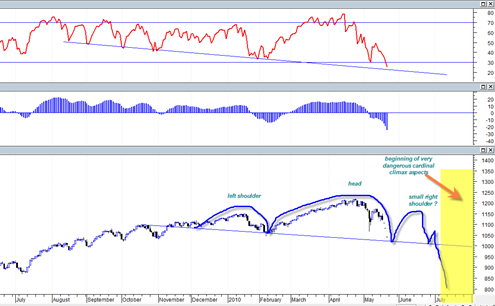
Nasdaq 2000 Price Collapse versus May 2010 SP500 Price Collapse

After letting the market action ‘soak in’ after the last two days I am coming to the conclusion that we will see two possible scenarios next week.

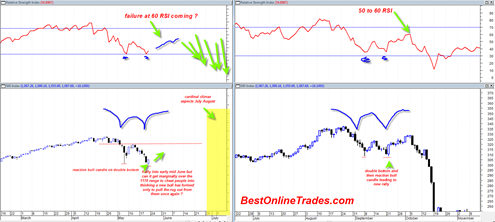
The first one is that we do not head down immediately next week or even mid week and instead tread water slightly higher or even into a new very marginal minor high that exceeds the 5/13/2010 price swing high.  This type of range bound trading action could take the shape of a symmetrical triangle formation that coils up the price action into a spring that breaks either end of this upcoming week or into next week.

The second scenario is that the market simply falls apart in a series of cascading declines into end of this week, or perhaps into the May 23, 2010 date.  This is currently my favored and gut feel scenario that will play out.  One of the reasons I am favoring this scenario is because of the heavy downside Friday volume.  It was not blow out volume but it was enough for me to sense that it could build into a climax volume with more price destruction.

Also the Euro is in a stance where it could spike lower and gold could spike higher to 1300 to 1400 an ounce in a matter of days.  If you look carefully at the Euro, Gold and the stock market, it paints a picture of some type of climax type move this week or next.

Read more

Went Long the TZA Direxion Daily Small Cp Bear 3X Shs Again Today

BestOnlineTrades went long the TZA again today after having closed out the previous position at 7.00 last week. I don’t normally like to scale into a position or add over time but the way the rest of the market is structured, it seems like an ideal risk reward setup right now. We have already snapped … Read more

Free Elliottwave Theorist Today a Deadly Bearish Big Picture

Elliottwave.com nailed this market turn once again, just as they called the March 2009 lows.  They are on top the current market movements and use Elliott wave theory as a market roadmap. Headlines are usually about what happened already, but Prechter’s headline is about what happens next. It goes beyond providing information. Yes, he wants … Read more