SPDR S&P 500 ETF SPY Fails to Test Swing Lows on Increased Volume

We are once again at a crucial juncture in the market and possibly a very significant turning point.

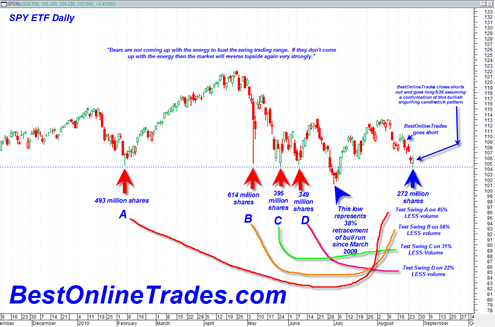
The SPDR S&P 500 ETF SPY today did yet another reversal and showed that the market is lacking enough energy to bust through the very critical lows of the large swing trading range since April 2010.

Today was a very very important day in terms of what the SPDR S&P 500 ETF told us.  Today the SPY tested several very important key swing trading lows going all the way back to March of 2010.  In each instance the lows were tested on substantially lighter volume which is a bullish reversal sign for the market once again.

The ultra bearish scenario may be completely dead as of today and I would say at this point to be extremely careful about being heavily short this market going into September 2010.

We closed out our short trade today on the SPY ETF and intend to go long in the morning with the following two conditions:

  • We need a bullish confirmation of the recent two day bullish engulfing candlestick pattern.  This means we need a close above 106.39 in the SPY.
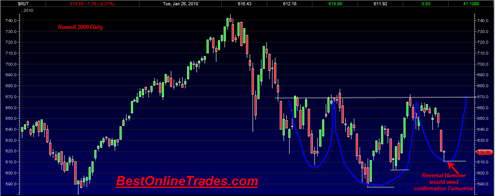
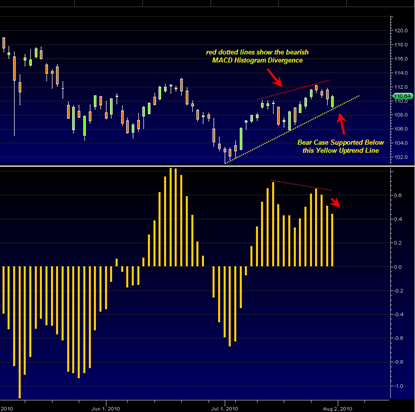
  • Secondly, we need a bullish close above 605.71 on the Russell 2000 as a confirmation of a MACD Histogram buy signal.  The Russell can tend to lead the market on both the bearish side and the bullish side of the market.  Right now it seems to be leading and showing a leading bullish possible buy signal on the Histogram

Probably most traders to not pay that much attention to trading volume.  But if you think about it, volume can potentially be the most important clue the market can give us because the volume is essentially the energy that moves markets.  It is the real money, the power that either has the force, or not.

Read more

Russell 2000 Showing Possible Head and Shoulders Bottom Symmetry

The Russell 2000 today is printing a reversal hammer that looks quite typical and reminiscent of the reversal hammer of 6/8/2010.  In the large swing trading we have been in over the last few months, these reversal hammers have been somewhat famous for picking exact bottoms in the markets large swing trading range. Today’s reversal … Read more

Trading Action Not Enough to Inspire the Bears Today

The market action today was definitely not very bear inspiring.  I have to be honest and say it was actually quite bullish looking on a short term basis.  We had the opening gap down near the July 1, 2010 up trendline and then a reversal to close higher on the day. This was somewhat similar … Read more

SPDR S&P 500 ETF Drifts Lower Today on Meager Volume

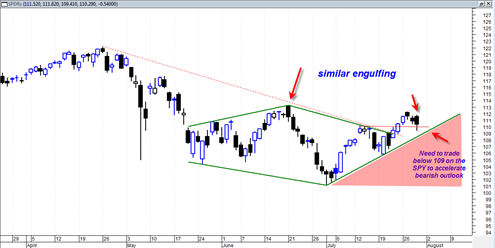
The SPDR S&P 500 ETF today broke down today on 35% greater volume than yesterday although still relatively lower volume as compared to other break downs in recent months.

Today the SPY candle engulfed yesterday’s doji candlestick on 35% greater volume.  On the Dow Diamonds DIA SPDR Dow Jones Industrial Average ETF today we engulfed yesterday’s near perfect doji on 55% greater volume.

This bearish engulfing setup is somewhat similar to the one that occurred on 6/21/2010 except that today’s engulfing has a slightly more bearish volume characteristic.

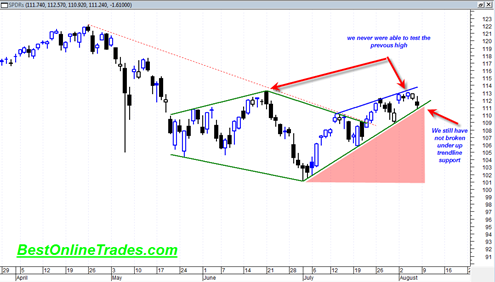
Despite these short term signals the fact still remains right now that the SPDR S&P 500 ETF is still trading both above the red dotted down trend line that has defined the bear phase and also above the near term green up trendline since July 1, 2010.

spy20100729

These two facts make it hard to be super bearish right now despite the near term signals of a possible turn down in the market right here.  It looks like the GDP report tomorrow is going to swing this market in a decisive direction.

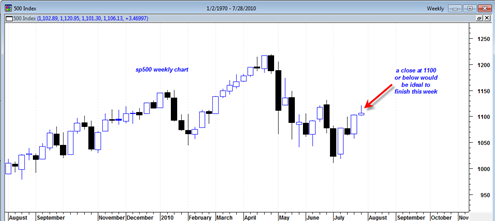
I mentioned in yesterday’s post that the 1100 level on the sp500 was minor support and ideally for the bearish case would close near there or below it by end of this week.  That type of close would set up a nice weekly hammer reversal candlestick and give a good shot at next week being hard down.  Breaking below the 1100 level enough on the sp500 could help to accelerate selling a bit and also create a 2B sell signal.  But again, unless we start trading seriously below the 109 level on the SPDR S&P 500 ETF then I have to conclude that the bulls still have some steam left.

Read more

Weekly sp500 Close this Friday Very Important for Bearish View

Today was only slightly down on light volume.  We did however confirm yesterday’s doji candlestick (by closing under it) as a reversal candlestick and someone emailed me that there was also a ‘bearish meeting lines’ candlestick formation on the two previous days candlesticks.  So both of these appear to be confirmed today. However despite today’s … Read more

One more Shot at the Short Side of the Sp500 and SPDR S&P 500 ETF

Despite my recent bullish tendencies I am becoming a bit concerned today about the uptrend.  I think it has exhausted itself today and may start to turn down tomorrow, perhaps very hard.  I am looking to go short the market tomorrow in the early AM via the various short ETFS and may be looking to … Read more