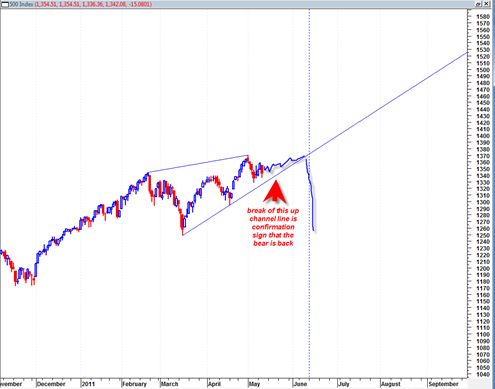
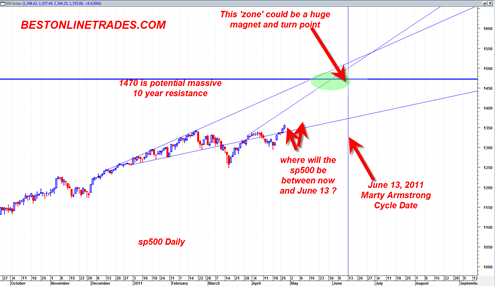
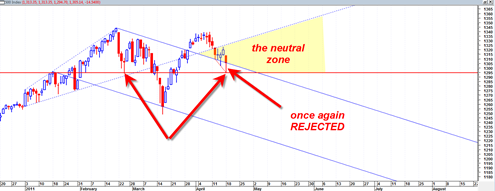
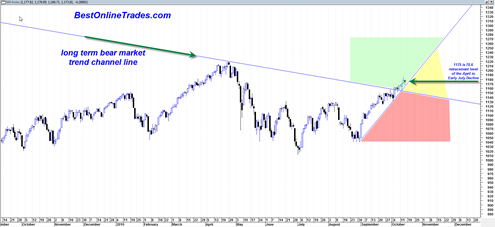
The price action in the market since the 4/21/2011 swing low has been quite laborious. Yes we have been in an uptrend, this is true, however the nature of the uptrend concerns me relative to the 2/18/2011 swing high.
This market is currently struggling to exceed the 2/18/2011 previous 52 week high, in fact it looks like it is embarking on a process to roll over (down). The observation which earlier today led me to initiate the BOT Short Signal was simply a quick look at daily, weekly and monthly MACD along with monthly MACD histogram. In addition I made an observation of the tape action itself from the mid March 2011 swing low and observed the angle of incline combined with the time it took to do the incline. This is definitely more art than science, but I have look at so many thousands of market charts over the years that one begins to get a good sense when the market is rolling over just by the pattern it is forming and not even looking at any indicators.
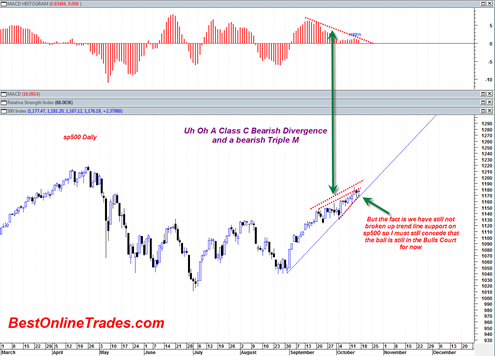
The fact remains right now that the daily MACD and the weekly MACD are in sell mode. The monthly MACD is in buy mode, BUT there does exist a large potential bearish divergence on the monthly MACD histogram that has the potential to crack this market down LONG TERM.
One could also make the argument that the monthly price chart of the last few months resembles a little bit the monthly price chart topping action of mid to late 2007.

