Monthly sp500 Price Chart Shows that July is Key Determinant Month

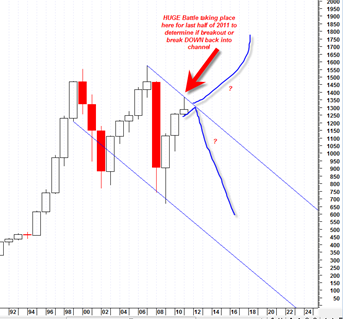
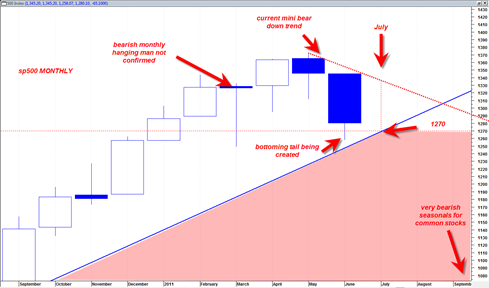
The low in the sp500 for June so far was 1258.  Today we had a nice sized rally.  With just 3 trading days left in the month of June the market now has the option to create a larger June monthly bottoming tail which shows demand, or continue down the last 3 trading days of June and perhaps even more so into the start of July.

Presently it is looking like the market wants to create more of a bottoming tail for June that could see the market rally into early July.

In the chart below this would create a June monthly candlestick with a longer demand tail and then create greater probability that we could see a rally as high as 1330 which is the top boundary of the current ‘mini bear’.

Assuming that actually does happen, then we could see 1330 hold as bear market resistance leading to a flat to slightly down August 2011 and then maybe a much more meaningful drop in the typically very bearish seasonally September.

Read more

ANOTHER Whipsaw Signal

It appears as though today may be yet ANOTHER whipsaw signal on the sp500 delivered by yours truly.  The market cannot make up its mind whether it wants to go down or up and I am cannot either.  I am getting thrown around in the spin cycle of a washing machine.

Today was another good example why it is usually not a good idea to get a strong conviction during trading hours as opposed to the closing price and final message of the market.

The close today was a high volume shakeout reversal on most indices that printed a strong looking reversal hammer on a candlestick basis.

After today’s close the upside is looking more favorable again.  What a difference a few hours can make!

But you know what ?  I would rather be ‘light footed’ giving multiple whipsaw bad signals as I have during the last 2 weeks instead of being ‘heavy footed’ stubbornly sticking to a bearish signal and then getting crushed and staying in denial when the market goes against me.  Light footed is a good thing sometimes.

I may have to switch back to a BOT long signal again depending on how things look into next week.

Read more

Back to the Monthly Basics on the sp500

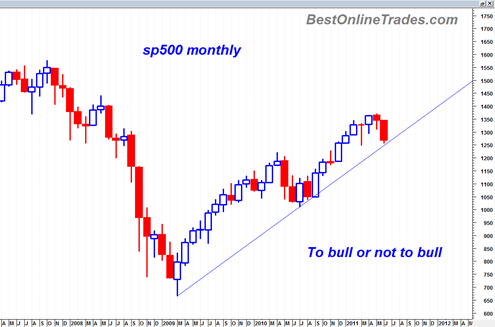
Back to the basics again.  The monthly basics.  I do short posts like this one just as a reality check.  It is very easy to get absorbed into the day by day action and the near term fear.

But the monthly chart of the sp500 right now since 3/2009 is still in an uptrend and still supported by an uptrend.  So, technically speaking I think we have to sit back and still say that as of today the sp500 is still in a mini bull market. 

Of course that could change next month or the month thereafter.  But as of this point in time the bull trend is holding.  It is simple point but an important one.  One that quite frankly I often forget to remind myself of.  It just goes to show how important it is to refresh the longer term time frames when it seems like the market is about to fall in a black hole.

Read more

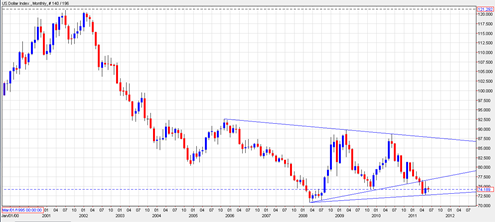
Death Spiral for the Dollar Below 71

A death spiral would occur for the US Dollar index below the 71 range in my opinion.  Currently the dollar appears to still have broken down out of a very large symmetrical triangle formation.  It is debatable exactly which line marks the lower boundary of the triangle formation, but the current monthly chart of the … Read more

RPRX Repros Therapeutics Speculative Biotech with a Nice Long Term Chart

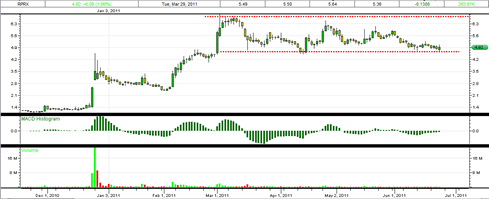
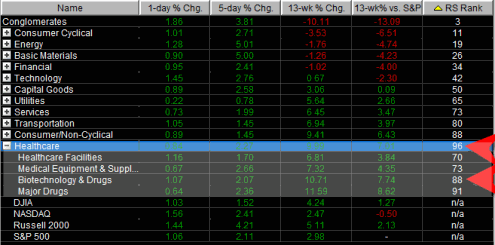
I like the potential setup of RPRX right now and going into the second half of this year.  In case you have not noticed yet, biotech and healthcare sector is on fire right now and currently has the strongest relative strength of all trading sectors (see first chart below).  Relative strength of sectors is important because it shows where current strongest momentum is and strongest money flow.

This is good for timely moves in hot stocks within that sector.

Previously I remember the oil sector was almost literally on fire.  But now it is near the bottom of the barrel in terms of relative strength and the healthcare and biotech sector are the new lead sled dogs.

rs

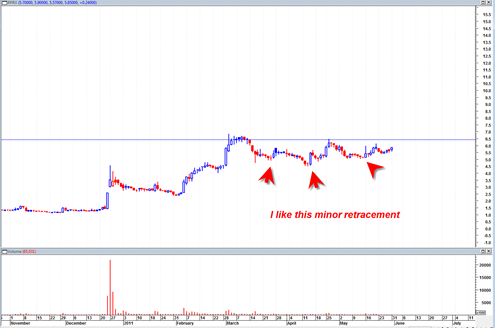
So with that in mind, RPRX Repros Therapeutics is a highly speculative biotech stock that has under 8 million shares in the trading float.  This means that this stock can really really move if enough volume comes into the stock.  A 10 million share day for RPRX would be the equivalent of trying to fit a basketball into a garden hose.

Read more

SLV ETF Looks like a Great Buy in this Range

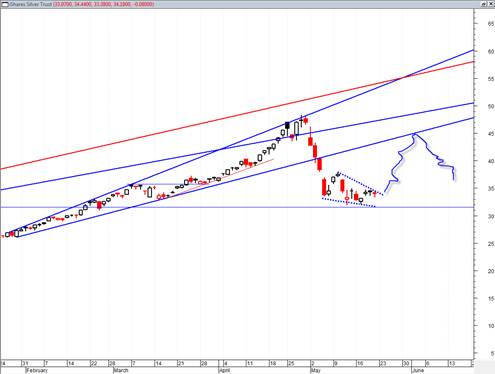
The SLV ETF looks to me like it is evolving into a great buy zone right now after the previous mini crash.  I indicated several times in the past that the 5/5/2011 climax low would be difficult to exceed given its blow out volume and also that the swing low of 33.58 would not be exceeded or only marginally exceeded.  Currently this appears to be exactly the case.

I think the SLV is a good buy in the current zone and I think it could move into a topside move that creates a trading range.

I would definitely be wrong if we break under 33 again significantly and close under there for several sessions.

It always amazes me how many are so quick to talk off the ‘silver crash’ and the end of silver and that the run is over after high volatility moves as we have seen.  The hysteria over new margin requirements and all the panic associated with that will eventually burn off.  This is not the end of the silver bull in my opinion.

Read more