Sp500 Rejects Near 1150 Range Again

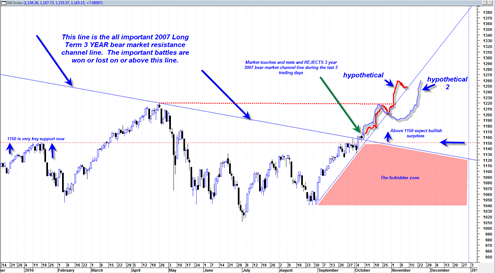
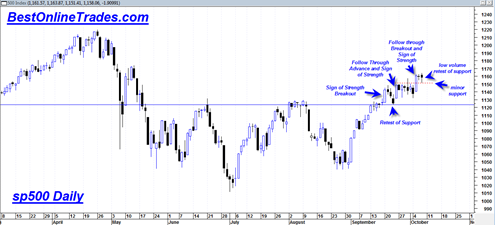
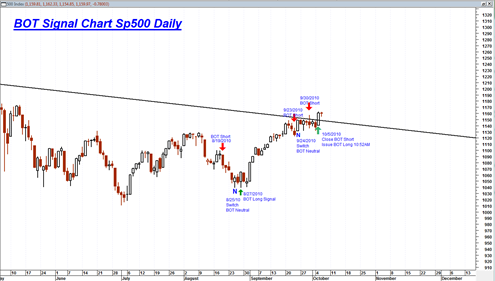
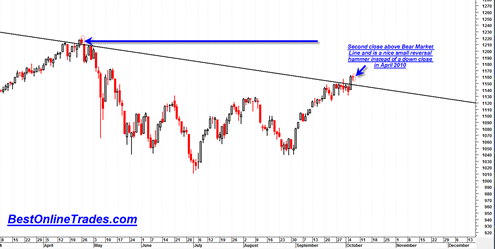
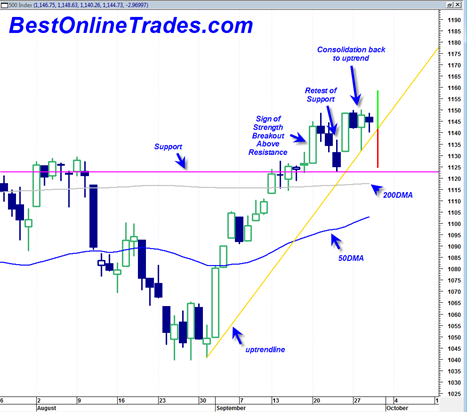
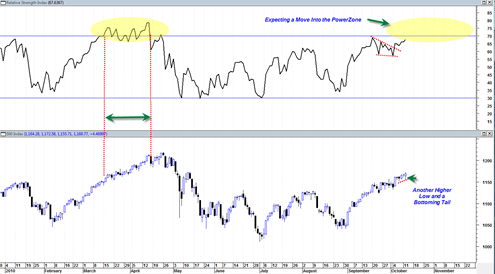
Today the sp500 hit an intra day low of 1155.71.  This was once again a move into the supporting range of 1150.  The sp500 once again today rejected this range and closed higher, signaling more upside to come.  It appears as though the sp500 will be able to jump over 1170 which should imply an eventual test of the April 2010 highs.  Today was the 6th consecutive close above the 2007 3 year bear market channel resistance line.

I am currently speculating that the sp500 will move into the RSI power zone above the 70 range at some point in October.  It is also possible that we could remain in the powerzone for a period of time somewhat similar to the behavior of the sp500 during the mid March to mid April 2010 time frame.  During that time frame (yellow highlight) the sp500 ‘trickled higher’ in a slow cumbersome fashion creating a series of higher highs and higher lows for one full trading month.

BestOnlineTrades currently believes this could happen again and it may once again last a full trading month or longer.  It depicts a potential scenario where one sees new shorts entering the market (top picking) and then having to repeatedly cover shorts after the market trends slowly sideways and then starts trickling up again.  Obviously this is not a profitable endeavor.  Shorting a market too early can indeed be quite costly.  And currently my longer term charts are suggesting that an extended bearish trend in the market may be quite a while away into the future.

Read more

sp500 Rejects 2007 Bear Market Trend Line for the Third Time Today

Despite today’s seemingly weak, boring and lack luster action, I thought it was extremely fascinating.  You will understand what I am referring to once I post the chart of the sp500 below.  The day started out with a somewhat muted reaction to the jobs report.  I knew that today was a critical day because any … Read more

sp500 Getting Ready to Blast Through 1200

Today was a consolidation day in the sp500.  There was minimal price give back given yesterday’s huge surge.  I interpret this as just another sign of the current internal strength of this market. The sp500 is poised for a revisit of 1200  and then eventually the old April 2010 highs of 2018.  The exact timing … Read more

NDX 100 Near Completion of Large Head and Shoulders Bottom

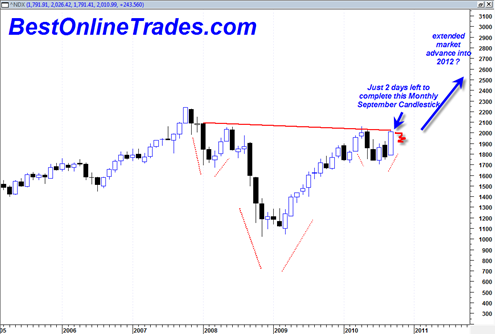
The NDX 100 appears to be coming close to completion of the large head and shoulders bottom formation identified in previous months here at BestOnlineTrades.com. The current September monthly candlestick on the NDX 100 looks very strong.  In fact it is the strongest monthly candlestick going back several years. It is still unclear to me … Read more

2050 and Change on the NDX will Likely Start a Minor Handle Correction

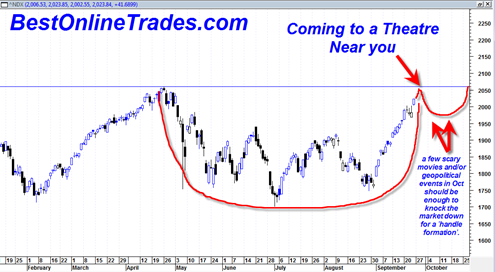
I feel as though I am becoming a bit overconfident with some of my latest market calls.  I need a gut check and a reality check.  Since identifying the major market low in late August 2010 (here and here) with volume analysis which then led to one of the greatest September rallies in the history … Read more