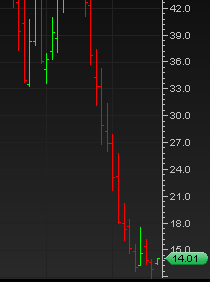
Quick Follow up on US Steel X

US Steel was up almost 9% today after my mention of it this past weekend.  I talked about how it appears to have a large head and shoulders bottoming formation.  Today’s action makes it look like the breakout from this pattern is in force.

The volume was very robust today especially for the first Monday in August.  This large head and shoulders bottoming formation has some rough targets. 

I calculate about 20 points between the low of the head portion of the pattern and the neckline of the pattern.  So the minimum measurement rule here suggests that US Steel could get to about 60.  Assuming this is the real breakout this week, then one thing to watch for is the retracement back to the neckline.  That may serve as a second opportunity to ride this new uptrend.

The size of this pattern is significant in that it is almost 1 full year long.  That is a lot of cause for a sustained move.  Head and shoulders bottoming patterns tend to be quite reliable in my experience.  They are not perfect patterns, but they do tend to give very reliable signals.

It should come as no surprises that US Steel got this move going in light of the fact that the US Dollar Index has broken down again in the most recent two days.  I talked about the US Dollar Index several other times and have said repeatedly that it is at a crucial juncture and at critical support.  Now it has elected to break that critical support.

Read more

DVAX Dynavax Technologies possible large Cup and Handle

DVAX20090803

Biotech stocks can be very tricky trades and very unpredictable, but I still thought DVAX was worth a mention as it appears to have a large favorable pattern also known as a cup and handle pattern.  The entire pattern is about 9 months in duration.  That is appealing just based on how long it has been forming. To me, a 9 month cup and handle is a lot more valuable than a 2 month cup and handle chart.

Anyway, it appears that the handle is almost done forming and we could see a big breakout type move out of this pattern, possible in August time frame.  One could also make the case that the handle portion of the DVAX chart is actually a smaller cup and handle pattern itself.  That is an interesting type of symmetry and something I do not see all too often.  It is a nice clear signal that helps to make for a clean move.

I really would not want to see anything below 1.74 on DVAX to keep this entire pattern intact.  If it does move below 1.74, then there could still be a case for an eventual breakout, but just for the sake of being ‘picky’ I think that is the standard that needs to be set here on DVAX.

Read more

Trend should now be up for UNG Natural Gas ETF

ung20090803 After a violent retesting action in the UNG ETF I believe that UNG has now bottomed and should embark on an eventual retest of the 17.55 level.
The recent break to new lows was a head fake in my opinion and we should now see a renewed bullish uptrend gain some footing.  The daily action showed that the most recent retest had to hold to keep any chance of a more significant reversal intact.

The monthly price bar chart of the UNG ETF as shown in the chart to the left tells us that the July monthly price bar showed some signs of demand in that we had a mid range close and test of the previous monthly swing 3 months previous to it.  That initial demand in the July monthly swing is spilling over to August now and I think it will continue.  Certainly there will still be volatility, but the trend will be up as I see it.

There also appears to be an island bottom formation on the UNG ETF that was confirmed as a result of today’s action and gap up.  Island bottom formations are very rare in the commodity futures market.  I don’t believe we had an island bottom on the natural gas futures contract, but I am still going to give merit to the fact that we have an island bottom on the UNG ETF.  It gives me a good dose of evidence that this is the final bottom for UNG.

Even a modest upward retracement of the UNG ETF bear market that it had could see it eventually doing a 50% move from these levels.

Read more

CNXT Conexant Systems Powers Higher after Alert

I talked about CNXT last Friday in the early afternoon and said “I would say that as long as it can hold 1.47 and keep its composure, I believe it could be setting up for another attack of that blue resistance line and a breakout type move”.

Today CNXT did not waste any time and shot up almost 29% from Friday’s close.  The pattern on CNXT was quite powerful.  It has a large saucer type formation after the huge sign of strength that occurred in mid-April.  Clearly CNXT had a lot of sideways cause (potential energy) building for about 3 months.

The clue was the big volume attempt at a breakout 3 days ago and then the retracement back down to support.  I said on Friday that it needed to hold 1.47 support other wise the scenario would be in doubt.  It did hold 1.47, so no complaints there.

Clearly the market continues to be in an active state right now with plenty of break out type opportunities.  Interesting that they are occurring this time of year now.  Perhaps the current advance in the broad market will continue into September before any more significant correction occurs?  That needs to be studied more closely.

But for now there continue to be breakout type opportunities and CNXT is just another example of one.

Honestly I would have to rate this CNXT breakout near the top of my list as far as quality, advance notice and overall setup type.  It was a clean setup and the probabilities here were very favorable.  Setups like this do not occur too frequently.

Read more

Gold Futures Gold ETFs and Gold Stocks Blockbuster Trade Alert

alert

BestOnlineTrades is issuing this blockbuster trade alert on the gold sector.  Whether it be Gold Futures, Gold ETFS (such as the GLD or DGP ETF), micro cap through large cap gold stocks, or even long dated call options, we believe the gold trade will be the most popular and productive trade for the next 9 to 12 months.

This is a very important alert and we feel that this alert may go down in history as being the most valuable and important alert we have ever issued. 

BestOnlineTrades has studied the gold market carefully since 2003.  We have seen and recognized the beginnings of this bull market at that time and feel that right now, perhaps even as soon as this week the gold trade will activate and turn into one of the biggest breakouts the world has ever seen.  It may not seem like a breakout at first, and it may disguise itself by transforming into a ‘slow motion’ breakout, but we believe it will still be seen in hindsight as being transformational.

While we do not talk too much about fundamentals here at BestOnlineTrades, we remain open to the possibility that inflationary trends will start to become more entrenched and severe during the next 9 to 12 months.  Part of the reason for this observation has to do with the fact that the US Dollar Index precisely aligned and topped with the April 21st, 2009 Marty Armstrong Cycle date precisely.  The Marty Armstrong Cycle is a very powerful 8.6 year global business cycle model that has proven itself to pick extremely important turning points in major markets worldwide.  The fact that the US Dollar has aligned itself to the model is an event in our opinion that is not to be taken lightly.

Read more

ETFC Etrade Financial in a Bullish Stance

ETFC20090801

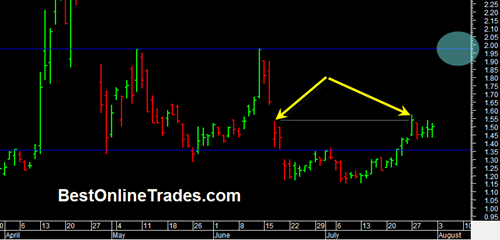
I continue to like ETFC Etrade Financial here.  I like the way it pushed into the gap on 20 million extra shares (illustrated by the two yellow arrows).  To me that is a bullish sign.  It has also managed to break through the bottom blue line which represents the bottom portion of this trading range which should act as support going forward.

The fact that price was able to break back into this trading range is very bullish indeed.  After it broke through and down the blue support line near the 1.35 level, the price of ETFC was supposed to continue falling and continue making bear market lows under 1 dollar.  But the bears could not accomplish that and price recovered back inside the trading range.  Now it has been flat lining sideways.

If ETFC can hold these levels with a worst case of a quick retest of the blue support line at 1.35, it could lead to a large run near the 1.95 level which would be an ideal exit point.

Read more

US Steel X Almost done creating Inverse Head and Shoulders Pattern

It really is quite amazing. I feel like a kid in a candy store.  There are so many long side setups now that it is hard not to find one out there.  It is a result of the strong bullish persistence in the broad market as it rebounds out of the depths of its bear … Read more

Powershares QQQ Trust does not want to Retrace

Today the powershares QQQ Trust, symbol (QQQQ) tested the gap from yesterday on about 25% less volume.  It has become clear to me at this point that any decline we get from here is going to be labored and lacking in conviction.

I still think 37.20 is fair game for a target on the QQQ Trust in August, but there are a few reasons why this may be delayed short term.  One of the reasons is the US Dollar index, which broke down badly today.  I am going to write a post on the US Dollar in a moment.  A declining US dollar is supporting higher prices in the broad market.

I should also mention that major topside resistance on the QQQ Trust comes in near the 42 and change level.  That level represents the primary bear market trend that began way back in October of 2007.  It is in my opinion a very significant level and one that we will be watching closely going forward. At the current rate the QQQ is travelling, we might just get there within a month or two.

It seems almost a foregone conclusion that this level will be tested.  The nature of the test on the weekly charts is going to be very important to watch.  If we see price bump its head on that down trend and have a fast reaction down, it could be a warning sign that the down trending resistance line will hold and not be broken.

On the other hand if we see price hug the bottom of that resistance line for say a month or two, then it could be a bullish sign and we might see a massive upside breakout through that bear market force.

Read more

PACR Pacer International Setting up for a Breakout

PACR

BestOnlineTrades recently developed a powerful new computer scan that scans over four thousand five hundred different stocks (Nasdaq and New York Stock Exchange).  It is a superb scan because out of that entire list of 4500 plus stocks it only returned 1/3 of 1% as viable candidates! (.27%)  And it typically seems to only return a maximum of 20 stocks each day.  That is extremely valuable not only because of time savings, but also because of the quality of the candidates it seems to find.  It is a custom scan I developed that uses a combination of two very powerful indicators.  One of them happens to be an indicator that the famous Jake Bernstein likes to use a lot.  But when used in combination with our own custom indicator, the quality factor goes up 5 fold.

PACR Pacer International is one of the stocks that came up in the scan and we are glad that it did, because it looks quite good to these eyes.  The few months to the left of this chart are also significant (not shown on the chart above) because in March PACR did a nose dive into the 1.7 range area, then it rebounded to the 5 level only to fall back where we currently are in this congestion area.

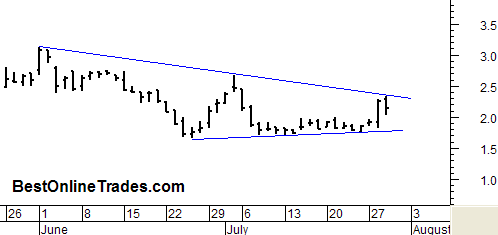
So one could say that the current retracement is a complex double bottom and now we have built sideways cause here for about a month and are perched just under the resistance line close to the mid 2’s.

Read more