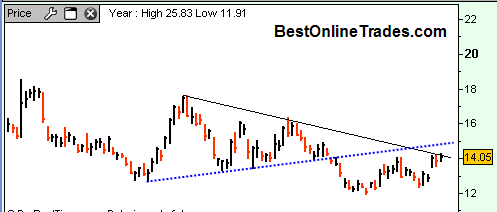
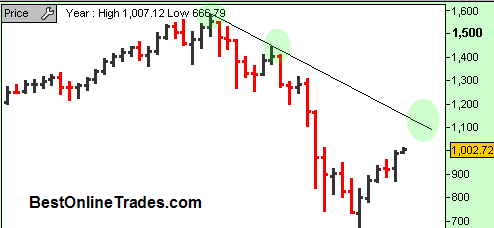
ERPLQ Energy Partners Limited may Breakout Soon

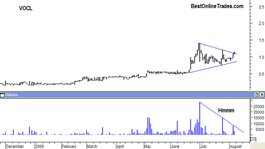
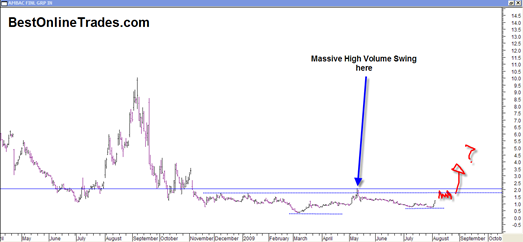
The market is taking a slight beating today but EPLRQ, a somewhat spotty and thin trade penny stock has a pretty decent pattern and may get a run going if it manages to consistently trade above .45. It pattern looks somewhat like a head and shoulders bottom formation with the right shoulder being much longer … Read more

StockTwits is a Great App for Traders

stocktwits

In case you do not know about it yet, you should really check out Stocktwits.  It is a great app for traders and connected to the twitter platform.

The reason why it is great is because it can be a good source of new trading ideas.  Basically all you have to do is go to the main site and watch new posts as they scroll down occasionally and automatically.  When you put your mouse pointer over the stock symbols at the end of each post a nice candlestick chart immediately pops up so you can judge instantly whether something interesting is going on or not. 

The nice thing about stocktwits is that you are looking at stocks that are the result of someone else’s analysis.  So there was some judgment involved in putting it there in the first place.  The caveat is that we have no idea how much experience or skill the person has who posted the symbol or chart and we have no clue whether they are more technical type traders or fundamental type traders.  Regardless, it can be a possible source of new trading ideas when either your scans are coming up dry or you cannot find good setups elsewhere.

Read more

Stock Scanner Results for August 7, 2009 AWBC and VOCL

awbc20090807 vocl20090807

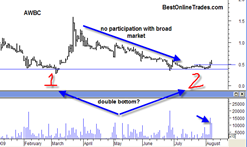
Only a small handful of stocks came up on my new scan that I discovered.  I got 6 results from over 4500 NYSE and Nasdaq stocks. Unbelievable.  I continue to be extremely impressed with this scan because it is returning so few candidates out of so many thousands of stocks.  And some of the candidates it returns tend to be at optimal time and price locations.  Now part of this is the result of the positive overall structure of the broad market, or is it?  I will not really know until I start to see the results of this scan in a more choppy sideways market or bear market.

The stock scanner also tends to reveal a lot of spotty type stocks.  With more spotty volume and price.  That is because I have it open to give me results on as many stocks as possible.  I am not limiting it to stocks that just trade above a million shares a day for example.  I do this because I do not want to limit opportunities of what it may find.

Anyway, AWBC and VOCL came up in the scan.  Both of them have somewhat spotty charts and VOCL has quite a small trading float (about 6 million shares) so it’s moves can be fast and sharp in both directions.  (click on each chart to see full size)

Read more

ETFC Etrade Breaks Down and Cannot Get a Rally Going

etfc20090807

Have you noticed how a lot of financial talk shows or internet sites seem to never mention the stocks or setups that turn sour?  Or maybe they only talk about the winners or how much percent they are up for the month or year.  I actually think it is a good idea to revisit setups that failed and then to try to figure out what went wrong or why it did not work out.  If we don’t learn from the failures then how are we to learn about what makes a good setup versus a bad one ?

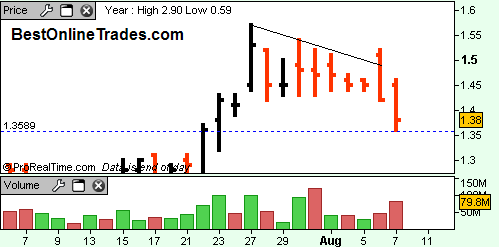
Etrade ETFC is a failure.  I don’t mean their business is a failure.  The setup I initially talked about is.  Etrade Financial broke down today on pretty heavy volume and this on the same day the rest of the market was up very strongly.  I don’t like to see a break down like this in light of such market strength today, and also to see it with such heavy volume.

Read more

EPEX Edge Petroleum coming close to a Decision Point

epex20090806

This is an important alert on EPEX.  I did a post before on EPEX Edge Petroleum.  You can see the previous post under the related posts section down below.  It looks to me now that EPEX is coming close to a decision point and I cannot say for sure whether it will be up or down but the probabilities say it is going to be an upside breakout.

There are two significant swings on EPEX that make this analysis worthy.  You can see them more clearly if you click on the chart above.  They stand out like a sore thumb.  But the key point to be made about those two price swings is that the second one had volume that was substantially larger than the first one.  That is an important clue about what the future direction of the stock price will be upon a breakout from this pattern.

My analysis shows that the direction will be UP.  However we will not really know until it happens… that is just the way these markets work, let them give you the signal and then go with the flow.  As of now EPEX is still constrained within this tight range.

Read more

It is time to put ABK Ambac Financial on the Radar Again

abk20090806

ABK Ambac Financial also came up in my new scan that I developed yesterday and also showed up in the MarketClub Scan.  As I just indicated in my previous post, the real estate sector is starting to rise from the dead a little bit and so this sector may be worth paying attention to.

I was lucky enough to play ABK Ambac Financial way back in August of 2008 after it had a massive bear market rally from a dollar and change to almost 10 dollars.  I remember it vividly because I was on vacation in Cape Cod up at the Eastham cottages and I remember trying to manage this trade with my laptop using the hotels wireless connection they had in the lobby.  I would go there every morning and then in the afternoons trying to engineer the Ambac trade.  At the time it was consolidating in mid August (see chart full size by clicking on it above) in a somewhat ascending triangle or symmetrical triangle pattern.  But I was stopped out several times and then had to re enter for the eventual move to 9 and change.  I had to be real careful about getting into Ambac because the stock had already had a big move and I was not in the trade right off the bottom, so I was unsure whether it had enough steam to go higher.

Read more

UNG Natural Gas ETF starting to look more and more bullish

ung20090805

On a risk to reward basis which is the better trade? The gold trade or the natural gas trade?  I think they are close to equal ground, but the more I think about the more I think that the UNG ETF Natural Gas trade is the one that has more merit in terms of maximum risk reward.

But let me be clear, the UNG ETF potential move is still a much different animal than the gold market.  I don’t think it can be said that natural gas is in a long term bull market.  It is an entirely different animal.  But nevertheless it has had a massive bear market crushing decline and now looks like it wants to get started on the ‘busted pattern’ setup that I had mentioned a couple times before.

Read more

Three Important Charts S&P500 Nasdaq Composite and the QQQQ’s

sp50020090805

I have three important charts to share with you that could help to clarify where we are and where we might be going.   These charts are pretty much self explanatory but I still believe they illustrate important points or guideposts if you will for future market action. The first is the S&P500.

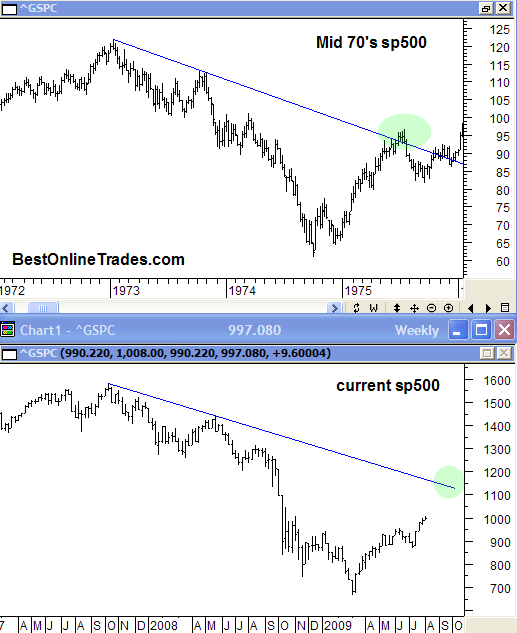
You probably know already what I am going to say with respect to this chart.  It is the monthly chart and it shows the powerful move up in July and now the follow through bar for August.  Clearly the August bar is just beginning but you can see we seem to be on a mission to the down trendline of the bear market that started in late 2007.  Now before I say anything more about the S&P500, lets look at the other two charts first.

Read more