Emini S&P 500 Futures Down Significantly this Morning

sp50020090817

The Emini S&P 500 Futures are down by over 20 points this morning.  That is the most I have seen them down in the morning for maybe the last month or so.  So it seems we could finally have a real correction to the downside kick in during the last two weeks of August.

I am still seeing a decent amount of upside setups, but this possible downward bias in the S&P 500 the next couple of weeks is worth noting and probably makes it prudent to be more defensive and shorter term the next couple of weeks.  There may be more failure breakouts and continuation breakdowns in individual stocks and the indices for the rest of August.

Read more

BestOnlineTrades may Focus Exclusively on CTIC Cell Therapeutics

ctic20090815

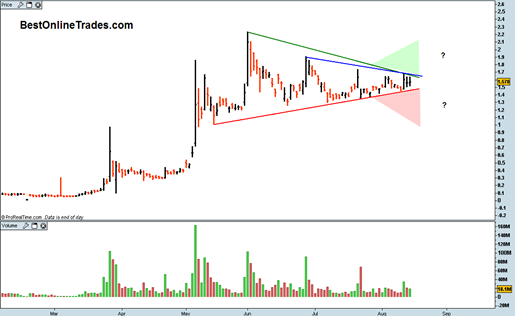
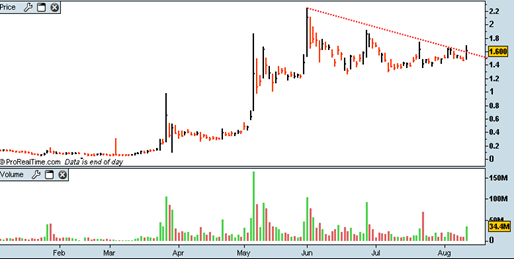
I hate to turn BestOnlineTrades into a ‘one trick pony’ for the next couple of weeks, but I may spend a lot of time covering CTIC Cell Therapeutics in a multi part series.  I will still cover some other topics as well, but I would rather focus in like a laser on CTIC and see what can be learned about its behavior and possible outcomes.

The chart of CTIC is notable for several reasons.  It clearly has a solid uptrend with very respectable advancing volume since the March 2009 time frame.  So it has shown us a clear sign of strength off of a major bear market bottom.  This is important because it helps to give added probability for possible future price direction.

Also notable is the fact that CTIC has consolidated sideways for roughly 3 and a half months AND it has not given back too much in the way of price. In other words, price has held relatively firm during the consolidation instead of slanting down or going into a deeper retracement.

Read more

Is a Sideways Correction the Worst the Bears will Give us?

spy20090814  The SP500 was down on this Friday the second week of August.  But am I surprised? No. Not really.  This is about the time that traders head for the beaches. Plus it is starting to get way too hot and humid outside to be sitting in a room in front of the computer all day.  So a good bunch of them probably just sold to cash today and headed for the beach or the pool or for their favorite ice chilled beverage of choice.

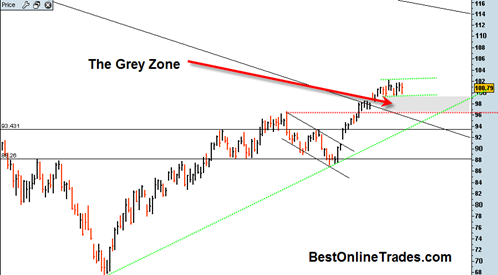
All the bears could manage today was another down day within the smaller green channel I have drawn in the chart.  I am still open to the possibility of 95 on the SPY ETF as a normal corrective retracement and testing of the breakout area.  It would get us into the ‘grey zone’ so to speak and help correct off some excesses.

Read more

CHB Champion Enterprises Setup Looks Good

chb20090814

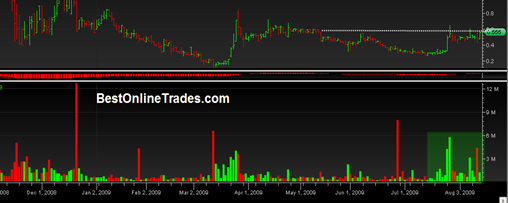
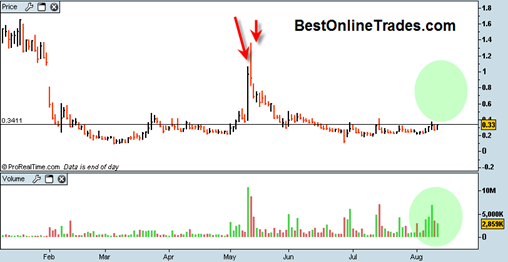
CHB Champion Enterprises has had some big volume come in recently (shaded in green on the stock chart above, click on it for full size).  And it is looking like a big move could be coming to the upside.

After a brief multi day spike up in March CHB has not really participated at all in the broad markets super rally.  After that spike up in March CHB pretty much has drifted sideways in what I consider to be a very long consolidation.

It drifted down in mid July in what appears to be a final bottom for CHB.  What is significant is that CHB did not continue to break down to retest the lows of March.  This is important because it is a hint of at least some strength in the stock and says that CHB is strong enough to resist a full retest.  It is good bottoming action I like to see.

Even more significant is that now CHB has had a big surge in volume come in on the recent advance and price seems to be consolidating in a sideways triangle type formation.

Read more

Nasdaq QQQ Blasts Higher today on Robust Volume

qqqq20090812

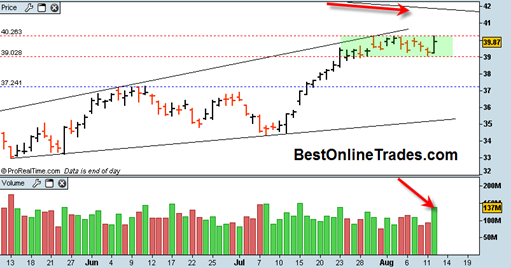
The move today in the QQQ was pretty impressive.  It was impressive in the sense that the bears should have been able to break under the green shaded rectangle and get the much awaited correction going, but the exact opposite ended up happening.  The upside volume was 137 million shares and is a solid way to get a bounce going inside that rectangle. 

This rectangle is depicting internal market strength once again to me and hinting at an eventual possible breakout above this rectangle to towards the 41.5 level which is right at the point of the long term bear market resistance line.  Perhaps we get a retracement the next could of days and then a breakout out of this rectangle next week sometime?

It is almost mind boggling that we are getting this strong price advance and this robust volume at this point in August.  It would seem that traders are in no mood to hit the beach this year.  They would rather be in front of their computer screens. Hmm.

Read more

CORS Corus Bankshares Could Get a Big Upside Pop Soon

cors20090812

CORS is an extremely risky type of play.  But without risk, then how do you get reward?  Anyway, I think this bank stock could possibly get a big pop soon, maybe even within the next 2 days.  There is a huge short position and to be sure there are all kinds of trading games going on with CORS.

But I do like the recent much heavier than normal 5 day advancing volume, but admittedly without too much price follow through.  CORS has been flat for about a month and a half and it is perched right under a longer term resistance level.

Read more

CTIC Cell Therapeutics May Start a Run Soon

ctic20090812

It is quite amazing that CTIC has had such a huge run from a beginning price of about .05 cents.  It has been an astounding run.  I was not smart enough to highlight it at .05, but that is a mute point now.  The fact is that CTIC has shown a huge sign of strength in the run from .05 to slightly above 2.00. 

But if you look at the chart carefully, you can see that CTIC has a certain trading personality and unique trading style that is important to take note of.

Read more

ETFC ETrade Rising back from the Dead

etfc20090812

Etrade Financial looks like it wants to come alive again.  If ETFC can get a move going above 1.52 and above that short term white down trendline I think we may see ETFC make a run for the 2.00 range later on this month.  I have been going back and forth on ETFC.  I indicated in my previous article that ETFC was not worthy of consideration anymore because it broke out of pattern on heavy volume and that the setup if any was confusing.

But if you look at the mini chart above you can see that ETFC has clearly held support of the 1.34 area, and that level of support is pretty solid.  So we bounce off that level today and are making a slow motion run back to the top of the range.  But ETFC still needs to overcome the shorter term resistance and get a move going above 1.52 for me to become even more encouraged.

If ETFC was to enter a more bearish scenario then ‘they’ should have been able to take 1.34 out readily the last few days, but ‘they’ didn’t … So now we are back topside again and maybe a new setup is developing here.

I have no clue how ETFC will close today and whether the FOMC news today will either ruin or enhance the run today.  A lot of times when I have seen the market up big ahead of the FOMC it seems like it has usually been a case of buy the rumor and then sell the news.  So I would not be at all surprised to the the broad market only up a couple points by end of day.

But let’s see how well ETFC can hold up today. 

Read more
SP500 about to get a Bullish Monthly MACD Buy Signal

sp50020090811

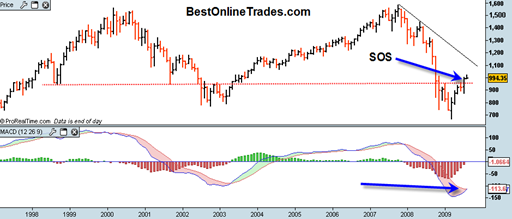
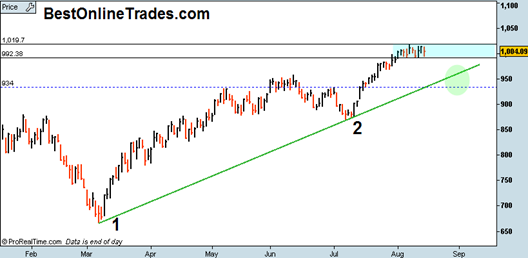
The SP500 is about to get a bullish monthly crossover on the MACD indicator, a popular moving average combination indicator that can become very useful over longer time frames.  The monthly MACD signals can signify new major bull or bear market moves with sometimes 1 year or more duration.

The current daily MACD signal is starting to flash some near term sell signals and could set us up for a move to test the 940-945 range on the SP500. 

It is confusing sometimes when you have a sell signal on one time frame and a buy signal on a different time frame.  To help clear the confusion, I always keep in mind that the longer term time frames have precedence over the shorter ones.  So while we could get some selling pressure into 940-945, we must remember that the longer term signal is indicating higher prices.

Read more

ANDS Anady’s Pharmaceuticals Possible Breakout Setup

ands20090811

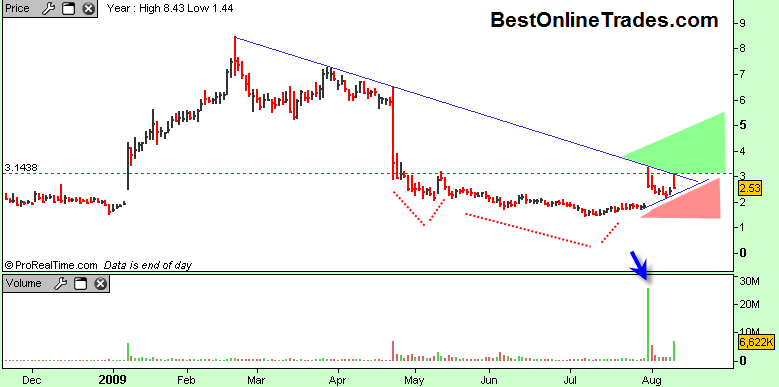
ANDS has had a couple recent big price moves to the upside, and the overall price structure is suggesting to me that ANDS could be setting up for a breakout.

After a brief strong run in the beginning of this year, ANDS went into a somewhat relentless decline to roughly 1.50.  It then had a pop up to the 3.00 range on blockbuster volume.  That pop was sold off intra day and today’s upside pop was also sold off intra day.  However the overall structure of ANDS has some notable and constructive aspects to it.

Although somewhat messy looking there appears to be a head and shoulders bottom formation with neckline resistance at 3.14.  The left shoulder was around 1st May, the head from mid May to end of July and the right shoulder the last 6 trading days.  If I am correct in identifying this head and shoulders bottom, then we could eventually see 4.50 as a target.

Read more