Four Words Today Gold Up Dollar Down

The US Dollar got clobbered today and gold popped up like a basketball submerged under water.  So far the supposed US Dollar rally is not materializing.  The dollar is trying to rally but it cannot seem to get any real ease of movement to the upside.  It still could, but it had better start soon because it is once again flirting with the critical longer term support line.  The price action today in the dollar looked like a real sign of weakness to me.

Meanwhile the gold price is inching closer and closer to the completion of its symmetrical triangle formation and I am slowly gaining more and more confidence that we are going to see a real breakout from this market come beginning of September.

The dollar index just keeps failing to get a rally going and I am thinking if it keeps failing like this for the rest of August it might turn into a real severe drop in September.  If that scenario plays out then it would help the gold price to finally get an upside breakout above the 1000 range.

Incidentally, if I am correct that we do get a gold price breakout, it will be important that the breakout materializes in the form of wide price spread and blockbuster volume on the upside.  We will have to take a look at the GLD ETF to get confirmation.

I still think this gold price setup has the  potential to be one of the greatest upside setups I have ever seen in my life if I am correct on us getting an upside break.  

21.70 on the DGP ETF ( The gold double long ETF ) is for me the green light signal that the breakout has started to initiate.  The “safer” upside trigger on the DGP ETF is 23.75 or above.

Read more

CTIC Cell Therapeutics Breaks Out on Substantial Volume

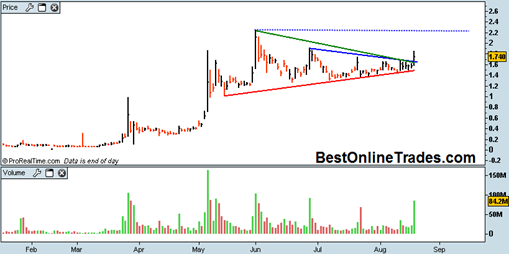
CTIC had a nice confirmed breakout move with confirmed volume and sign of strength above the down trend resistance lines of its larger triangle formation today.  This is part 3b in a multipart series on CTIC.  I first started tracking CTIC when it was compressing into the apex of this triangle on August 15th, 2009.

ctic20090819

So far all systems are go on CTIC in my opinion.  The bombshell volume today and wide price spread is exactly what we wanted to see as confirmation of the beginnings of a breakout.  The price of CTIC did retrench at the end of the day but it still achieved a somewhat better than mid range close for the day. Not bad at all.

It appears that the price is starting to move in anticipation of that so called forward looking news event that may or may not occur on August 24th which is upcoming Monday. 

Read more

Spot Silver and Silver Futures Headed for Upside Breakout in September

This monthly chart of the spot silver price is saying that the price of silver and silver futures are going to break out topside in September – October time frame.  The silver price has consolidated into a down slanting head and shoulders bottom formation.  The monthly MACD is about to cross north and price is … Read more

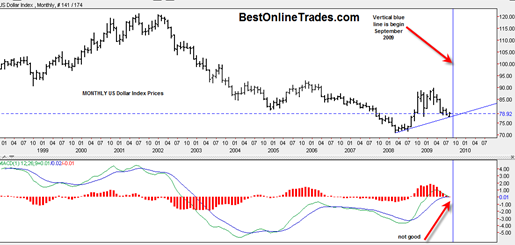
Monthly US Dollar Chart Indicating it May Break Down Severely in September

monthlyusdollarindex

I have some new information on the US Dollar index and wanted to bring it to your attention.  My obsession with the US Dollar Index continues… But why? Why am I so obsessed with the US Dollar Index.  I am because it is either going to help gold do a MEGA breakout or it could potentially hinder any breakout in gold or even cause a break down.

I just wrote a post on the negative seasonals that are kicking in for the US Dollar Index starting right now.  But I only just now discovered a new perspective on the US Dollar Index that is giving me a little extra dose of confidence that we could see the US Dollar break down severely in September and subsequently cause the gold price to spike to a new all time 30 + year high.

Read more

The Gold Market Chips are on the Table so Lets Roll

DX

The gold market chips are on the table and the US Dollar chips are on the table, now lets roll…

The gold price has now touched the top portion of the symmetrical triangle 3 times and the bottom portion 3 times.  One way or the other we will get a resolution.  Time wise I have calculated that the gold price cannot really extend much farther then end of September to make a decision because there is simply no room left inside the triangle.

The thoughts that go through my head when I look at the gold price triangle are something like, “Can this market really get an upside breakout?”, “What if the gold price extends too far into the apex?”, “This chart better start resolving itself SOON”.

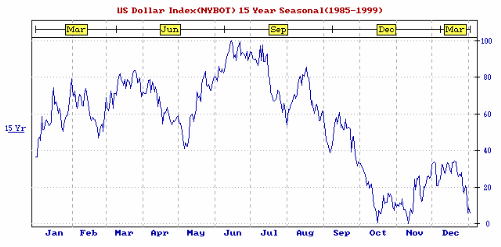
The chart above is the seasonal US Dollar chart between the years 1985 and 1999 courtesy the Moore Research Center.  What is interesting about this seasonal chart is that we can see that the US Dollar tends to have a lousy second half of the year statistically between years 1985 and 1999.  And if we look carefully at the chart we can see that the most devastating statistical downside for the US dollar starts at MID AUGUST (we are in mid August 2009 right now) and then continues almost relentlessly until mid October.

Read more

CEGE Cell Genesys May be building for a Breakout Continuation Move

I have been watching CEGE closely, another biotech stock in the face of today’s broad market weakness.  It is holding up quite well and I am impressed so far.  I am also impressed in CEGE’s breakout on big volume two days ago that marked a valid break of it’s longer term down trending resistance line … Read more