Sell Rosh Hashanah and Buy On Yom Kippur ?

My sense is from a market timing perspective is that we are coming into some very interesting weeks ahead here closer to mid September.  I previously mentioned that there exists a triple bearish divergence in the S&P500.  These bearish divergences in a bullish uptrend can drag on for what seems like an eternity sometimes. But … Read more

Spot Gold Closes Over 1000 Again

spotgold20090911

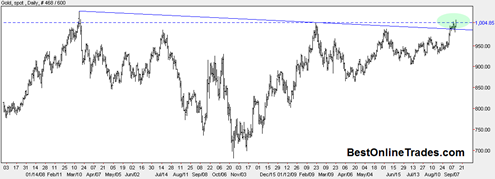
If you take a close look at the chart above you can clearly see that the spot gold price has successfully broken above the longer term down trendline since this mini bear market in gold started in March of 2008.

Despite this bullish action there is still a lot of talk that gold will break down again and maybe go to 850 or somewhere near that level.

I have a hard time believing that at this point.  I would rather just trust this simple chart which is saying to me that a successful break of the bearish downtrend has occurred and so now it should be assumed that we should eventually get continuation to the upside and probably at a faster speed than usual because there is zero resistance on the left side of the chart above 1034.

Read more

I Screwed up the UAUA UAL Corporation Trade

uaua20090910

I hope this post does not turn into a rant.  I screwed up and missed the UAUA trade yesterday and it has been bothering me all day today.  I didn’t even bother to write up the possible scenario here at BestOnlineTrades and maybe that is partly why I screwed up the trade because I did not talk myself through the necessary parameters of this trade.

Two days ago I did my usual scans of almost 5000 nasdaq and NYSE stocks and nothing was coming up in my scans.  Nothing good was coming up anyway and so I was getting discouraged.  Also I have been somewhat off center lately because I have been confusing my own forecasts with that of other’s who are looking for market crashes and big downside.  I am not blaming others for my own general confusion now, I am just saying me dipping my hands into the cookie jar of other’s market forecasts has messed up my own judgement.  That is just a fact.

Read more

ABK Ambac Financial Group May Recover after Market Correction Ends

abk20090901

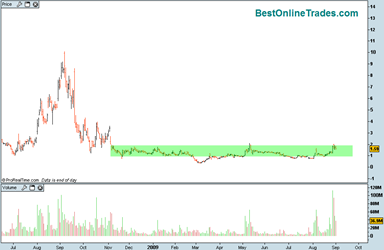
Ambac Financial Group has been trading in a sideways trading range for almost a year and has not managed to break out above the green congestion area shown in the chart (click on it for full size).

It is clear now that the broad market is in a corrective process and that we are likely to see lower prices in the weeks ahead.  How deep and long that correction runs is a mystery to me still at this point. 

I would expect ABK to get some sympathy downside from the broad market decline in the weeks ahead.  But at some point ABK may be setting up for an upside breakout out of this trading range.  The thing I like the most is the huge volume accumulation in the month of August.  It could be an early sign that a major new uptrend is in the works.

Still, ABK is very volatile and needs to work off some of the recent spike it just had. 

Read more

S&P500 Finally Starts a Real Correction

sp50020090901

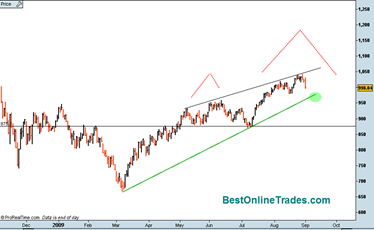
There is no doubt about it, the SP500 finally started a more serious correction today.  It was able to evade this correction for all of August but the shorter term bearish divergence was hinting that some sort of down move was in store.

You can clearly see from the chart that the SP500 is confined by the longer term green up trendline and the top black channel line.  It appears that we want to trade down now and test the bottom of this channel.  It is going to be important for that green up trendline to hold price during the month of September otherwise it could warm of a more involved correction that may see us trade down to the 870 range. 

But for now I am going to assume that the green up trendline holds support.

I also sketched in a couple of red lines on the chart pointing out the possibility at least that a somewhat large head and shoulders topping pattern may develop if we continue to correct down to 870 on the Sp500. 

Read more