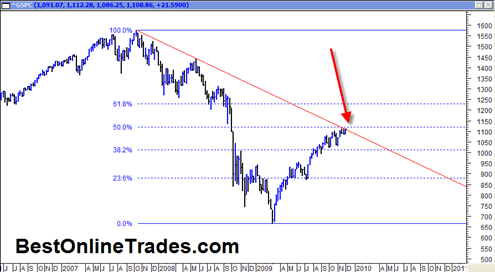
I would be completely remiss if I did not point out once again the important juncture the market finds itself in right now. The chart above is one which I believe LOTS of people are focusing in on right now. Why?
Well because the chart above (by the way, it is the weekly price chart) helps to summarize the market in a nutshell and defines some very important parameters that could be very key going forward.
First, it shows the entire extended bear market leg from 2007 into 2008 and then the current massive retracement higher right up to the red colored down trend line that defines this bear market. So we know that the market at least as defined by the SP500 is perched right under long term resistance. We also know that this is the THIRD attempt back up to the red down trendline. The fact that it is the third attempt can be important because usually you will get a successful breakout on third attempts.

