They Do Ring Bells at the Market Top

493px-Taco_Bell_logo.svg

I am more confident than I have ever been in recent months that today’s action in the markets (SP500, DJIA, Nasdaq etc. ) marks the beginning of a much longer consolidation/correction phase than we have seen since March of 2009.

I am still long the TZA and plan to stay that way as a core short position for at least the next 3 to 4 weeks.  I have a game plan and will tell you about it shortly because I still feel as though I have somewhat of a ‘cheat sheet’ on this market. 

Anyway, here is a brief summary in bullet form the reasons why I believe a long corrective phase is at hand that should see the market decline between 10 to 15% from the recent highs…

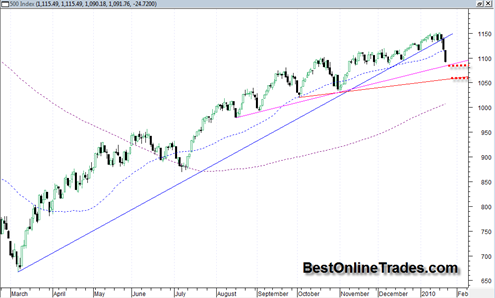
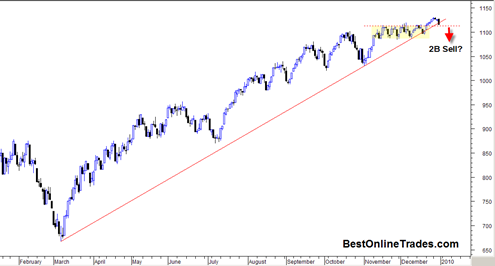
  • The SP500 has broken decisively the very long bull market up trendline that has been in force since March of 2009.  This was the high angle up trendline that has defined this bull trend and it was broken very decisively with a wide price spread and very high volume especially in comparison to volume levels of the last month or two advancing rally.
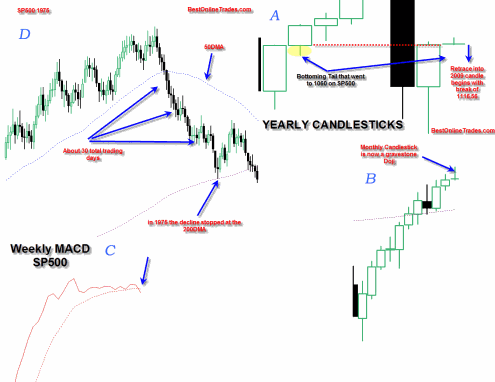
  • The WEEKLY MACD has finally confirmed a bearish downside crossover today which means that now the price trend should transfer to a “3 steps down 2 steps up” type action.  I have mentioned the weekly MACD many other times in previous posts and each time it looked like it was going to do a bearish cross, it them reversed and stretched itself out and evaded the sell signal.  But this time it failed to evade the sell in a big way especially when you consider the heavy volume and wide price spread to go along with it.
  • The Monthly January 2010 candlestick bar on almost all major indices has now transformed into a very bearish looking reversal hammer ( which implies that February will likely see the majority of the most devastating downward price action).
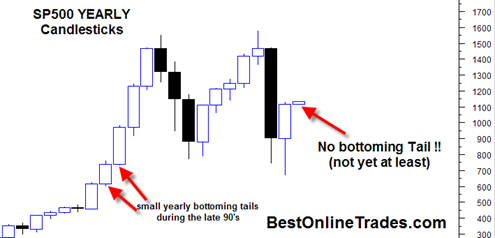
  • The YEARLY 2010 candlestick has now transformed into similarly very bearish looking gravestone doji.  The yearly 2010 candle now very clearly to me is saying the market wants to do some price retrace down into the 2009 candle.

Those are the main points that give me confidence on this trend change.  Now onto the charts…

Read more

The Stock Market Will go Up in a Straight Line in 2010

I am kidding of course, but I had to write a catchy title for this post given how we are starting the first day of the new year in the market.  I find it very significant that we ended the 2009 YEARLY price candle only inches away from the high of the YEAR.  And now on the first trading day of the YEARLY 2010 price candle we are in a gap and go situation.  That is an extremely bullish type of candlestick behavior because it does not create any ‘bottoming tails’ on the lower portion candle.

It is true that we can still see some type of selling the next week or two that will create

So far at least we see a huge sign of strength today across the board.  Even the financials (XLF) are rallying after that very long consolidation pattern which could have been seen as a major topping pattern.

Obviously I was stopped out of my TZA position this morning.  And at this point I have decided not to go short again later this week.  In fact I am looking for long side opportunities again. 

One just has to respect the bullish tendencies of this market.  So I think finding long opportunities is the early game plan again for now.  But at the same time being aware that bullish sentiment readings are at record levels and make the long trade a very crowded type of trade.

sp5002010104

Read more

SP500 Set Up for a Wild Monday and First Week of New Year 2010 ?

The charts are saying that this first week of the new year 2010 has the potential to be quite a volatile week.  I am considering the possibility at least that we finally get a meaningful hard down week this first week of January or at least start to see a lot more volatility as compared to last month.

The bollinger bands on the SP500 have contracted into a very narrow band over the last month but they have started to slightly expand.  I suspect that the volatility expansion is going to be to the down side, but a lot really depends on how we close Monday, the first trading day of the new year 2010.

Looking at the uptrend line that has defined this bull run since March 2009 we do see that the SP500 is once again sitting on this uptrend line and at risk of breaking down and through it. 

sp5002010103

Read more

The Short Side of the Market is Not Working

My little experiment at trying to pick another top in the market did not work.  I dumped FAZ and will now stay on the sidelines and look for long opportunities in stocks and/or ETFs again, but very selectively of course.

I said in my previous post that we really needed to see the market do some real damage to close this week out to keep a nasty bear trend going into next week.  But it did not happen at least 20 minutes before the close today and now it is looking like the complete opposite will happen.  A continuation run in the markets that may even accelerate into new year time frame and beyond.

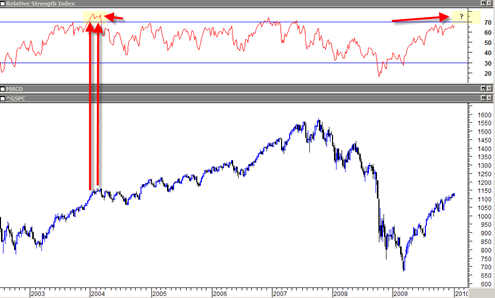
We are now piercing on the SP500 ABOVE the 50% fibonacci retracement level of this entire bear market instead of breaking down and failing below it.  In addition the WEEKLY MACD sell signal I had mentioned some time ago has turned into a failed signal and the market has once again evaded a possible bear trend signal.  This is the same type of thing that occurred in the 2003-2004 period were the weekly MACD kept repeatedly failing time and time again and the market just kept doing very small 2 to 4 % corrections but then just kept trending higher and higher, although it was flat for quite some time too.

We may enter a similar type scenario next year, where the market does have corrections but they are never more than 3 to 5% and the market moves still in a more modest uptrend and then sometimes long sideways trend.  That type of market environment would make it very difficult for bears to get large amounts of ripe fruit so to speak and it would probably be extremely frustrating over the longer term for them.

Read more

SPY ETF Shows some Possible Ominous Bearish CandleStick Patterns

SPY200910172009

There are only about 8 real trading days left until the end of the year if you exclude the days around Christmas.  So that means about 8 trading days to create the final YEARLY price bar close and then start the next one for 2010.

The market has powered up so fast and so persistently in 2009 that one would think people would take at least a few points of profit and capital gains.  For us to close the 2009 yearly price bar only a couple points from the yearly high seems improbable.  Just like on a daily price bar right before 4PM you see day traders exiting, I think we could see similar type price behavior going into end of this year.

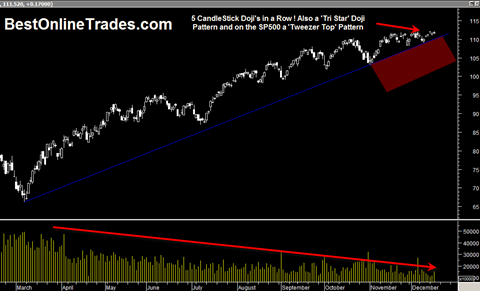
In addition I should also tell you that I have noticed some OMINOUSLY bearish looking candlestick formations in recent days on the SPY ETF and DIA ETF and also the SP500.

Read more