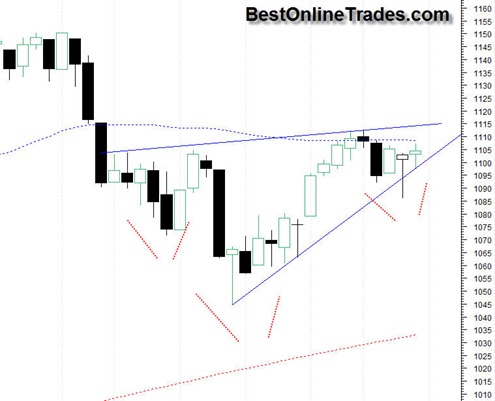
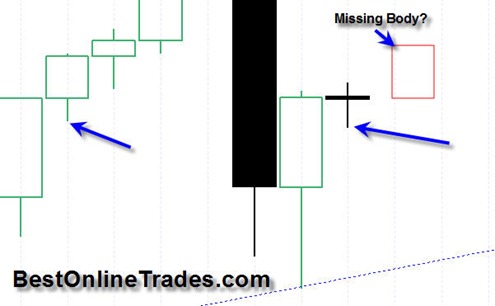
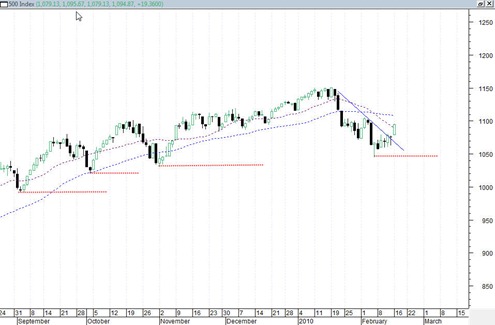
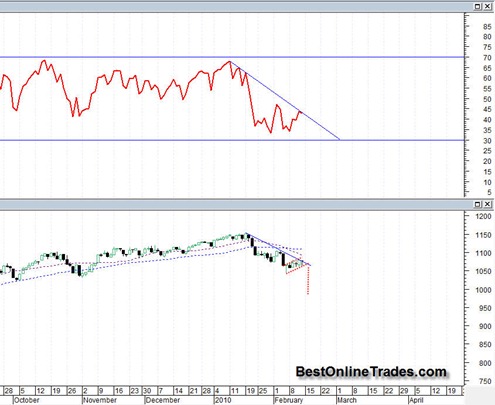
The stock market bears failed once again to deliver on persistent bearish follow through out of the potential bear flag and persistent down trend. Not only did they fail in that regard, but they also failed to evade a bullish daily MACD buy signal and they failed to break the market to a new low range ( I am referring to the low ranges shown by the red horizontal dotted lines).
The fact that during the entire 3 week decline the market failed to break to a lower low by definition still characterizes the market trend as being in an uptrend despite the previous 3 week decline. Albeit it is a much more modest uptrend, but uptrend it is.
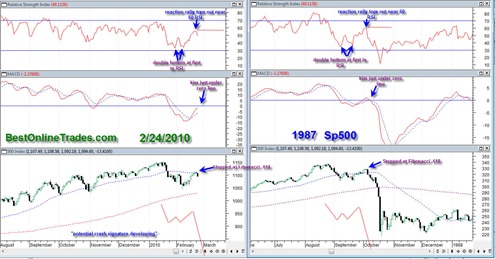
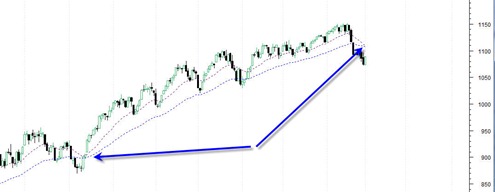
It is starting to look like the 1929 scenario is wrong. The 1975 bear scenario may also be a no go at this point as well. That would leave the 2004 sloppy swing trading range corrective scenario which is the one I labeled scenario number 3.
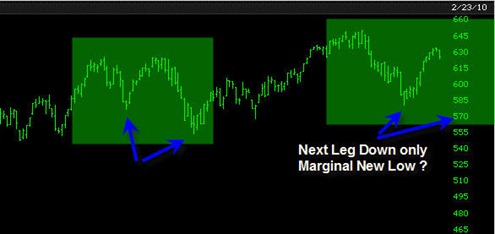
So this could mean the SP500 wants to trade back up to 1130, and then start another corrective leg down again, breaking the 1050 range but only slightly to perhaps 1030 range. And then swing back up again within the large swing trading range.
It is way too early to tell if this large swing trading range is going to have a slight upward slant or a slight downward slant. But the bottom line is that this type of trading range is in my opinion very difficult to trade and ought to be quite frustrating to say the least.

