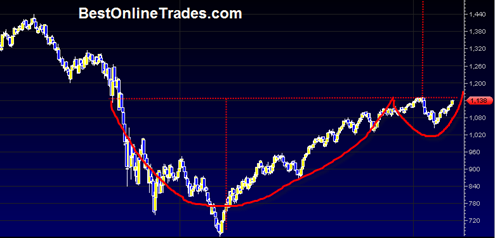
Market Bullish Tendencies Keep Rolling on

The market is zooming right into April and the previous monthly MARIBUZU (almost a maribuzu) candlestick is so far evolving into anther maribuzu candlestick for April.  The market is strong. There is no denying it.  The WEEKLY relative strength index is getting close to busting into the 70th percentile powerzone which is a rare but … Read more

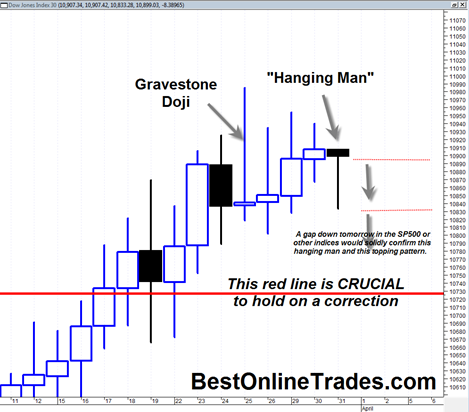
Dow Jones Industrial Average and SP500 show Hanging Man Candlestick

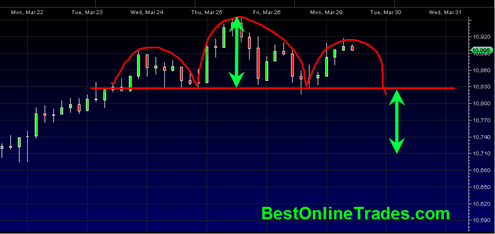
Breaking news development… The Dow Jones Industrial Average as well as the SP500 Index are currently as the time of this posting showing another potential bearish implication candlestick formation. The formation is the bearish hanging man candlestick.  This candlestick looks like a bullish hammer, has a small body shape and a tail that is at … Read more

Went long the TZA Direxion Daily Small Cp Bear 3X Shs 7.50 April Call Options

Today’s reversal candle was pretty nasty looking and serious enough for me to jump into the TZA Direxion Daily Small Cp Bear 3X Shs 7.50 April Call Options.  I will probably go long the TZA directly or some other inverse bear ETFS tomorrow.

This looks like an important top, but it is way too early for me to be talking about it being ‘the top’.  It could just be a swing trading type of top, but it looks serious. 

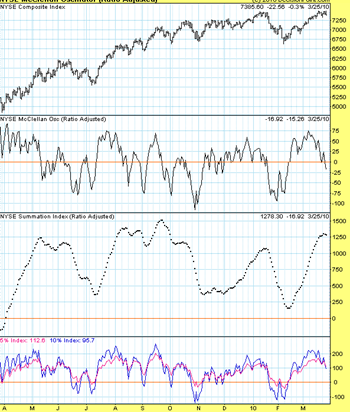
In addition the Mcclellan Oscillator looks very ominous as I see a double top in price of the New York Stock Exchange and an oscillator that looks ready for a steep decline.  Price usually follows the oscillator down.

mclellan20100325

It remains to be seen how well some of the stocks behave in the coming correction.  I just got done talking about how great LVS Las Vegas Sands looks, but if the market as a whole falls apart, LVS is going to have to the 20 level, otherwise a more complex correction could ensue and it would have created a false breakout.

Its funny how yesterday I was talking about not shorting this market until the 50 day crosses negatively down through the 200 day moving average… but then only a day later I am trying to be a hero calling a market top.  I guess it is just too tempting to try to nail an exact top because most of the ‘juice’ of the decline seems to happen in the first 20th percentile.

Read more

AIB Allied Irish Banks and LYG Lloyds Banking Group PLC (ADR) Still Bullish

Both of these bank stock charts are still looking bullish to me for more potential upside in the week(s) ahead.  The attraction of AIB is that it is late in the recovery compared to many US banks, but still the price chart has some positive aspects to it in my opinion.

For starters, it has what looks like a double bottom that has about 1 full year distance between the potential bottoms.  The substantial distance between the potential bottoms is a good technical setup that could have a lot of potential significance from a longer term perspective.  The double bottom is not a confirmed double bottom.  I am just trying to make an ‘early call’ that it will be one as we go forward.

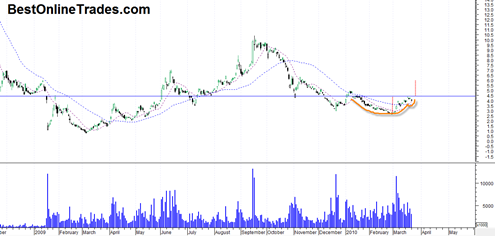
AIB appears to be testing a resistance range and has recently stalled there.  There is some slight resemblance to a cup and handle pattern developing that could send AIB to the 6 range assuming we get a northward breakout this week or next.

aib20100322

Similar to AIB, LYG Lloyds Banking Group, another ADR (England) appears also to have a quite bullish looking setup for a breakout north through resistance soon as well.

Read more

Kicking Myself for Missing the CAGC China Agritech Inc Put Option Trade

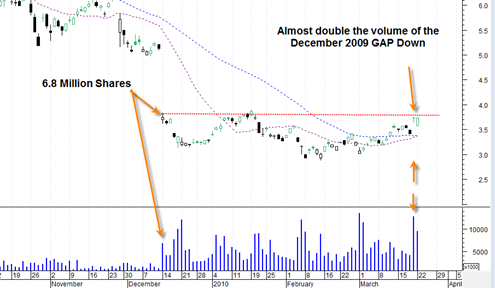
I really hate it when this happens.  I a couple days ago I wrote about the rare bearish tri star candlestick formation that had formed in CAGC after the enormous 130% + percent run up in only 1 months time frame.  After I wrote about it, I took a little bit of time to see what the March Put Options were doing on CAGC.  I was eyeing the March 25 out of the money put on CAGC which at the time was trading somewhere near .20 a contract.puts

So then I was thinking to myself how great a potential short term trade this would be in CAGC if it could somehow get to 25 or at least close to 25.  But then I started doubting the trade since it only had till the end of this week till expiration and I feared that the bearish tri star would not evolve into a bearish follow through soon enough.  And I really thought it would be a long shot for CAGC to get all the way to 25 with only a few days remaining until expiration.  Also in the back of my mind was the persistent resiliency of CAGC and its ability to hold up strong.

In the final analysis my little fears and doubts and failure to pull the trigger on this trade (ie. actually taking the trade) was a big mistake because it ‘could have’ led to a 400% to 800% profit in only 2 or 3 days !!!

Read more

The Market is looking Very Bullish Do Not Short this Market

The SP500 has elected to break above the crucial 1116.56 level that I had alluded to several times before.  This is a very bullish development and now opens the door to expanding upside price action moving forward into 2010. I cannot recommend shorting this market now.  The risk reward is simply not there.  That is … Read more