Stock Market has Switched into Overdrive

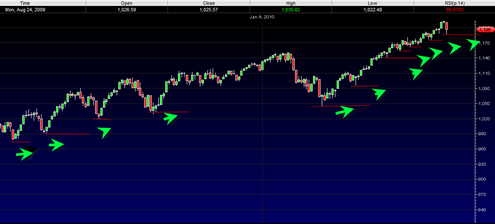
The market has switched into total overdrive with the weekly RSI reading currently showing 72.62 above the critical 70 line.  BestOnlineTrades has been correct in maintaining the stance that this reading should be perceived as internal market strength and not a sudden reason to short the market.  The path of least resistance remains up and … Read more

Prediction for the Week that Begins 4/19/2010

I could be wrong about this, but I predict that we end this week higher in the broad market.  I also predict that Goldman Sachs will end higher this week than where it closed last Friday.

My guess is that investors will come to their senses when the Goldman earnings come out Tuesday and realize that this company is almost literally a non stop printing ATM machine and that any liabilities they have to pay out will be simply that, cold hard cash and a tiny fraction of what this company can earn in the real world.

In addition to that there are plenty of other earnings reports to chew on this week from a good portion of the SP500 index and the DJIA as well.

So it will be interesting to see how it all shakes out.  But for now I think higher by the end of the week or at the very least some decent base building before another move higher.

Ambac Financial Group, Inc. ABK may trend lower for most of this week and I would like to see it find support near the 1.00 range where there was an extremely high volume gap.  A more towards the 1.00 range also comes near the 78.6% retracement level and is an area where it has found support on previous mega spikes.

Read more

Market Tops are not Made in One Day but Market Bottoms Are

Today is another interesting day on Wall Street.  The Arms index hit a high today of close to 3.65 and tells me that today’s decline is most probably a one day oversold type event.  The market was very clearly in heavily overbought territory and very overdue for some type of pullback.  And so when any market gets in such a severe overbought level the smallest piece of news can be enough to get a big correction going.

How we close today will still be important as a setup going into next week.  If we close near the lows today then it could be a sign that next week will see some downside follow through.  On the other hand a decent end of day rally today may set the stage for a bounce next week to work off this oversold situation right now.

It is possible that this is a more significant top, but we will probably need another attempt at the highs for better confirmation.  So far the SP500 is still trading in a higher highs and higher lows type situation and until that changes I give the benefit of the doubt to the bulls.

Read more

Fannie Mae Level 2 and Chart Structure looks Good

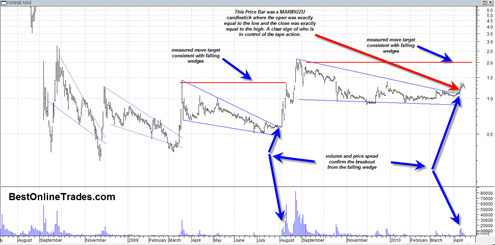
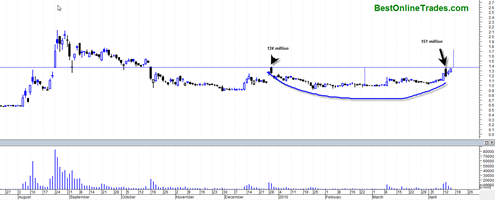
Everything is flying up lately including the ever so hated Fannie Mae and Freddie mac.  These two stocks are laggards however they do seem to be catching a good spark and overall the chart structures of both seem supportive of a big breakout within the next two weeks or so.

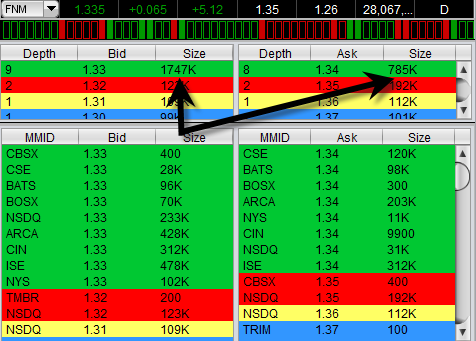
I have been watching level 2 on both of these stocks and I have consistently seen very strong bid support relative to ask volume.  In fact on some occasions the bid support has been stronger than ask volume by a factor of 10 to 1.  So it is telling me that there is some heavy accumulation going on the last several days and ‘they’ appear to want to take both of these higher. 

This should not come as surprise however because most other financials stocks are zooming higher as well such as AIG and BAC and C as well.  Both FNM and FRE are late to the party so to speak but it could be that they are doing a pre earnings run up which I have not been able to confirm as May 6th, 2010.  Yahoo Finance says May 10th, 2010.

fnmlevel2

Level 2 has been useful to me to see the demand and supply situation of a stock.  Usually it is just useful for entries and exits but sometimes you can see a pattern emerge over time as seems to be the case with both FNM and FRE.

Read more

This could be a very important Market Timing Chart and Signal on the QQQQ

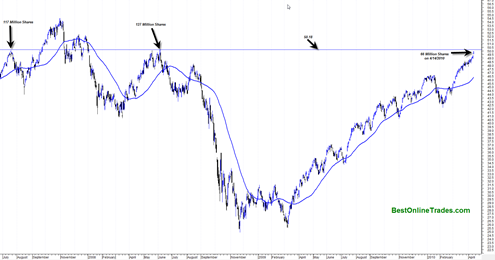
I just loaded up a longer term chart of the QQQQ Nasdaq tracking ETF (PowerShares QQQ Trust, Series 1) and I found a couple of potentially important clues.  The clue has to do with the current level the QQQQ is at right now and where it is situated relative to two other very important peaks.  It also has to do with the volume level at those peaks and the current volume at present day.

Nine times out of ten (my own approximation) whenever you have a stock or index reach a previous key peak level in the market, there is usually some type of retracement for the simple reason that previous holders want to get their money back.  Another reason is because technicians are also watching these levels and use it as an excuse to sell.  And a final reason is the quality of the volume test because in volume analysis you need volume that is within 3% or greater of the previous highs volume for there to be an eventual successful breakout from that level.

The chart of the QQQQ as shown below indicates that it is only .54% away from testing a very key previous resistance level both in terms of price and volume.

qqqq20100414

Basically we are within ‘inches’ of this key level.  The key level on the QQQQ is 50.18.  This is a key level because you can see from the chart the two previous key price peaks were generated at this level and they were relatively sharp peaks.

Read more

Freddie Mac May Move in Sympathy with AIG soon

Freddie Mac (FRE) currently price at 1.34 may move higher in sympathy with AIG American International Group, Inc. soon.  FRE continues to be dogged by the housing depression and the government involvement or lack thereof.

However the economy is on the mend and there are some bright spots appear that may lift the shares of Freddie Mac  FRE soon. 

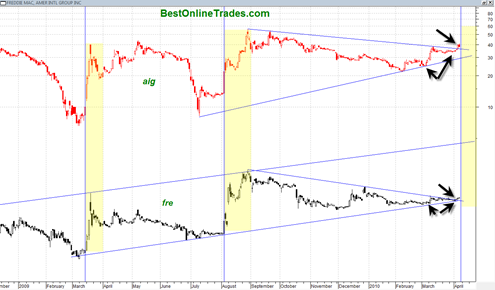
If you put the share prices of AIG and FRE right on top of each other you will see a general tendency towards symmetry on some of the big moves each stock has made over the last year.  There appears to be a slight lag effect in the movement of FRE relative to AIG.

Significantly, AIG has just recently broken out north from a very long term downward sloping resistance line and what also appears to be a very large triangle formation.  Similarly Freddie Mac  FRE has also just done the same thing although it has not really had a breakout type move out of this triangle yet.  To accomplish that it will need to trade and move over the 1.38 level which it may do early next week.

Read more

Silver Futures Looking Extremely Bullish next 6 to 12 months

If I am starting to sound somewhat repetitive, I am doing it on purpose.  Here at Best Online Trades I like to try to focus on the best risk reward scenarios at any given time.  Sometimes they are short term scenarios, other times longer term scenarios.

What has me very keen and interested right now is the precious metals sector.  And now even more so, the silver sector.  One of the most under rated and under covered sectors worldwide, the silver sector (which includes the silver price itself and the silver mining stocks) may be about to come more alive than any other sector in the market place.

The issue is though which is the best area of silver to participate in assuming a new strong bull leg is coming ?  My own personal take is that the AGQ ProShares Ultra Silver ETF is probably the best way to play the likely coming move in silver.  The AGQ is leveraged twice positively towards the silver price.  So if the silver price manages to make a 100% run in the next 1 to 1.5 years, then AGQ should perform close to 200%.

Now tell me where else in the next 12 to 18 months can you expect a 200% return? In the stock market ?  Bond Market ?  Real Estate?  Probably no, no and no again.

Individual silver mining stocks should get a good run going as well.  But since I have been watching the precious metals mining stocks since 2003 I can say that in general I have been usually disappointed in many or even most individual mining stocks performance relative to the metal itself or even ETFS.  There are just too many uncontrollable variables with the individual miners.  Why take all that extra risk when you have leveraged ETFs? I suppose it comes down to a question of greed since in some cases you will find individual mining stocks (juniors) go up by factors of 2, 5 or 10 of most other instruments.

Read more

My Quick Take On the 30 Dow Jones Industrial Average Stocks

-Ok here it goes… Alcoa Inc.  – Still in a decent uptrend but starting to look a little bit ‘labored’ American International Group, Inc. – Looking very bullish with recent breakout and big volume and RSI (Relative Strength Index) entering the ‘power zone. American Express Company – Recently rallied back up to previous 52 week … Read more