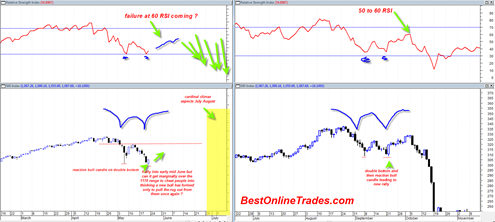
This morning I was looking at the 60 minute 20 day trading chart of the sp500 on Power Etrade Pro. The last hours bar of yesterday (6/1/2010) was a big red down candle and it looked ominous. So when trading started today I began to realize that there was not going to be any downside follow through. Then I also realized that that big down candle was the right shoulder of a head and shoulders bottoming pattern on the 60 minute chart.
So the rest is history and now the market is in full bounce and short covering mode.
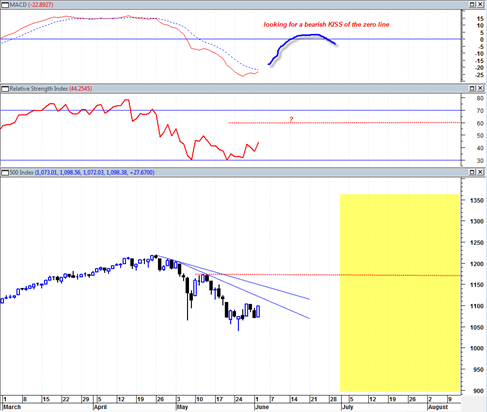
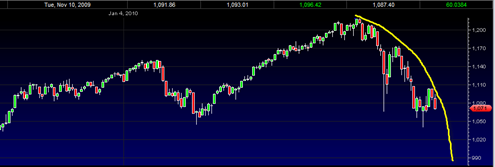
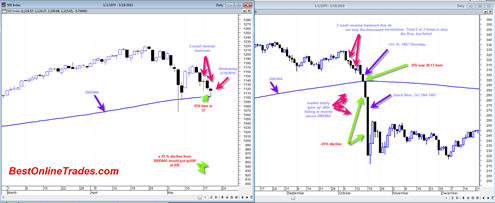
This was my original forecast after I identified the Adam and Eve double bottom. But the action of 6/1/2010 was a really confusing head fake because that one day’s price action was enough to turn the daily MACD indicator DOWN and had me thinking we were setting up for total collapse without delay similar to the September 2008 period.
But alas, the market rejected that scenario and is now in full bounce mode off of this Adam and Eve double bottom.
I suspect that the employment report this Friday is going to be good enough to send the market higher and then eventually into the 1150 –1170 range. The key question is how long this will take ?

