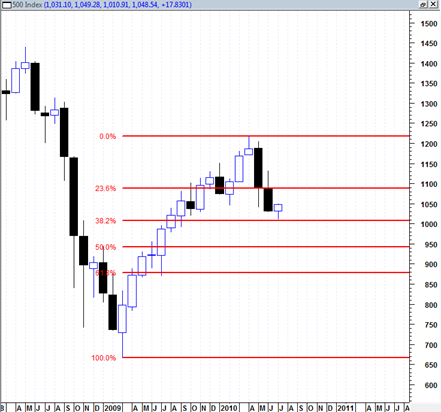
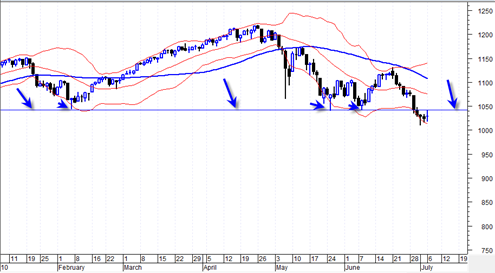
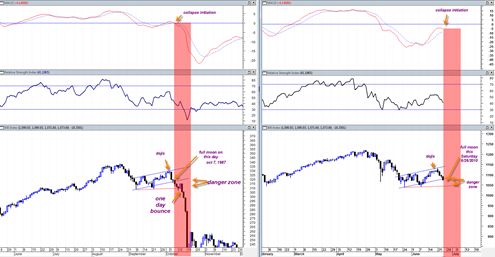
1045 would be a Perfect Close on the sp500 Today

I have no idea what price we will close at today.  But ideally somewhere close to 1045 would be ideal.  It would potentially set up the final catapult needed to flip this market around one last time.  I think the bears should be hoping for a strong close today.  It would help the pattern similarity.  … Read more

The End Game

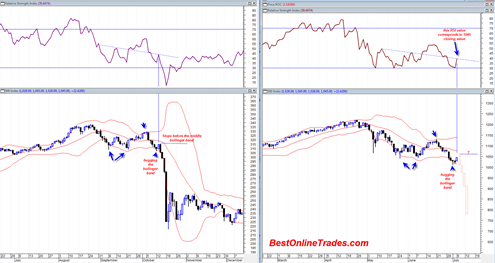
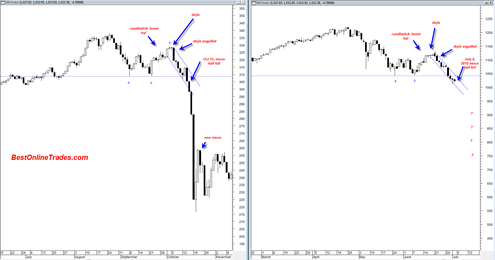
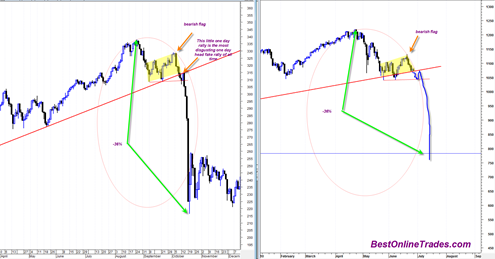
My sense is that we are at the end game during the next two weeks, the final stage of what I think will be a mega crash.  I sense this from my extended observations of the 1987 price chart versus the 2010 price chart.  The structures are so similar it is not even funny. 

Just to sum up some of the reasons why I believe a mega crash is likely to occur:

  • The rally since the March 2009 lows was a low volume manipulated rally by government interests.  Markets can only be manipulated for brief periods of time but ultimately they tend to resume to where they were trending before the manipulation and reflect real economic realities again.
  • The market right now is cranky, in a bad mood, and has a bad looking nervous tape.  That is not the type of action you like to see for new bull trends.
  • The rally from the March 2009 lows was arguably an ‘automatic rally’ given the nature of the severe plunge into 2008.  The downside follow through after automatic rallies are complete in my observation has many times led to crashes (at least in individual stocks).
  • IF we are really about to enter a massive deflationary economic spiral it is not uncommon for the market to signal this fact with some type of ‘shock and awe’ campaign.  A big crash would do the job and signal to the world that the market has started to price in a zero growth deflationary environment.  The market may suddenly start to build in price to earnings ratios of 1 to 5 instead of 15 to 20.
  • The Jobs Killer
  • The pattern similarity to 1987
  • The Astro Cardinal climax aspects which kicked in late June and seem to be exerting some serious downside pressure on the market now.
  • Almost no one is calling for a devastating rock bottom crash where prices go down and STAY DOWN.  Actually this is not entirely true. Richard Russell has been talking about a crash as well as Bill Mclaren.  Bob Prechter is bearish and looking for much lower prices but I have not heard him specifically talking about a huge down move happening in the next couple of weeks.  Perhaps he has for his paid subscribers (see elliottwave links on left sidebar).  There have been plenty of more underground type sites and blogs looking for a crash however, but not too many mainstream sources from what I have observed.

I have spent many many hours staring at and studying the nuances of the 1987 topping pattern as compared to our current topping pattern.  The pattern similarity is strikingly similar.  The candlesticks and engulfing patterns are similar.  And the final act, the subtly down sloping decline leading to a vertical decline is also similar.  We are situated right now in the subtly down sloping decline.  The most important question now is, do we transfer into a persistent vertical decline as 87 did. The time similarity is what is missing.  The 2010 pattern is taking longer to form and this may or may not destroy the correlation.

Read more

It Feels Like a Bull Market in Reverse

The candlestick reversal hammer that printed yesterday 7/1/2010 was not confirmed today.  The bulls needed to get a close above the 7/1/2010 candlestick to say we had a real market reversal or short term bottom.  They did not get the job done today and even worse sold the market off a bit right during the last 5 minutes into the close.  On some indices the last two days look similar to the two printed dojis we saw on 6/25 and 6/28.  After 6/28 we had a 3% down day.  So again these dojis seem to be indicating a pause in the trend but not a reversal of trend.

Looking at the NYSE McClellan Oscillator and summation index I see nothing but more indications of continued downward momentum.  The NYSE summation index reversed at the zero line and since then has had strong momentum to the downside that seems to be gaining steam.

You remember the bullish move from 2/5/2010 to 4/23/2010 ?  It seemed like the market was an unstoppable train.  It seemed like 1999 again but maybe not as glamorous.  It felt like the market was invincible again.  Doji and hammer reversals were completely ignored and the market just kept going and going and going, the market was climbing a wall of fear, although there was probably not much fear left at that time.

Now it seems like there is fear everywhere and the bulls are hoping for a bounce to change the trend.  Those who missed the shorting opportunity on 6/25/2010 are still waiting for a nice big bounce to get an ideal short.  So my question is, what if the bulls don’t get their bounce reversal and the shorts don’t get their ideal shorting opportunity next week?  The answer probably is that the market just tanks where bulls finally capitulate and new shorts pile on late in a frenzy before they miss the boat.

Read more

Flash Crash Part 2 Coming the Next 3 trading days into July 6 2010

Everything I am looking at right now suggests to me we are about to ‘engage’ on flash crash part II during the next 3 trading days.  I am talking a one day 7 to 10% down day during one of the next 3 trading days.

The only confusion I have left is whether or not we get a huge ONE DAY bounce before hand perhaps on the order of 2 to 2.5 % with a close near the highs.  If we do get a one day bounce then it really ought to happen tomorrow.  We are in a spot right now where it is ideal for a big one day bounce to occur.  I suppose it could also happen on Friday on a less than worse jobs report, but that seems like an unlikely scenario going into a 3 day long weekend.

On the other hand I am seeing signatures that look very similar to the stance the market was in right before the May 6, 2010 flash crash.

Not too many others seem to be calling for a crash.  Other than the Bill Mclaren interview I posted the other day which was on CNBC, I do not see anyone else on CNBC talking about a crash, nor do I see it on popular message boards.  The traders who were previously looking for a crash have pulled in their horns or are looking to go long.  Perhaps it is because we are in JULY and not October.  A crash just cannot happen during a slow summer month of July right ? Wrong.  It is probably the worst time for one to happen too because everyone is starting to pack their bags for the 3 day holiday weekend and looking forward to fireworks and grilled hot dogs.

Read more

Stock Market Crash Day 7 Market Breaks Last Trendline Support

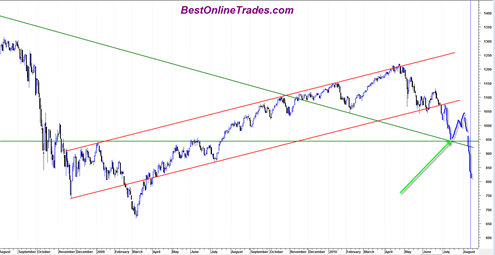
Today was a very key day in the stock market and the sp500.  Today we broke down through with conviction what I consider to be the last remaining supportive trendline of the advance since March 2009. Not only was this line broken with a wide price spread, but was also done with volume conviction.  It … Read more

Stock Market Crash Day Four and Five

Today’s market action sure felt like we either had a Fed decision or options expiration, but this was not the case at all.  It was simply slow sloppy directionless Monday in late June trading.

I think the market today succeeded in keeping most bears and bulls completely clueless about what the next direction will be. 

It has seemed as though in recent days that most if not all of the bearish bloggers I follow and other traders have turned neutral to long this market.  Or they have closed out shorts and are waiting for 1150 or October 2010 before re shorting this market.  My personal take is that neither of the above two will happen.  My take is still that this market will collapse in the days and weeks ahead based on my indicators, chart pattern analysis and tape read of this market.

I can come up with plenty of reasons why this market could rally from here from a technical standpoint right now (at the bottom of a swing trading range, relatively low volume decline, oversold readings, full right shoulder not formed yet, poor seasonality for a new decline etc etc.)  But I can also come up with a good bunch of reasons why the market could still collapse from here as well.

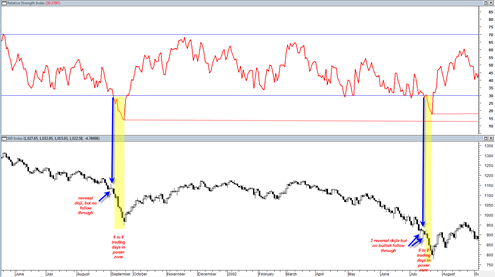
By the way it is nice to see that Bill McLaren on CNBC Friday sees very similar to what I see coming.  He mentions about a move to 1040 and then a big one day bounce and then a total collapse after that.  Actually I see instead a move down in the market the correlates with 14 day RSI (relative strength index) getting to 30, then a big one or two day bounce from there and then a total collapse.  The most concerning aspect of this forecast is the fact that he actually came public with it on CNBC from a contrarian standpoint.

Read more

Stock Market Crash Day Four

It seems as though a lot is riding on tomorrow’s price action.  As of today’s 6/24/2010 close it would seem that everything is lined up for a hard down weekly close as I indicated before was an important requirement to continue the crash scenario.

But when I look at the current sp500 trading channel on an intra day chart one can clearly see that as of today’s close we are in a spot were a huge upside bounce could come in.  In addition 1076 is about where a 61.8% fibonacci retracement comes in from the June 8th, 2010 low.  So there is some support and enough reasons to cause a big bounce.  This really is a key area we are at right now.

So the issue is, do we bounce dramatically tomorrow early on and then fail at the end of day for a weekly close near the bottom of the range ?  To me that would be the most ideal scenario going into the supposed bearish Astro Monday the 28th of June, 2010.

Closing weekly hard down right before the weekend has a way of allowing the market to build up energy over the weekend to accomplish a break of important support (in this case) or resistance.

So clearly the most ideal scenario for those bearish on the market is a close near the 1050 range tomorrow.  Already being down 4 days in a row makes it seem unlikely we would get another down day tomorrow.  However I have seen many times markets run up repeatedly 5,6,7,8 or 9 days in a row to the upside in the most bullish environments, so why can’t the market get a string of 5,6,7,8, or 9 days in a row of downside moves ?  It is possible, but not highly probable.

Read more