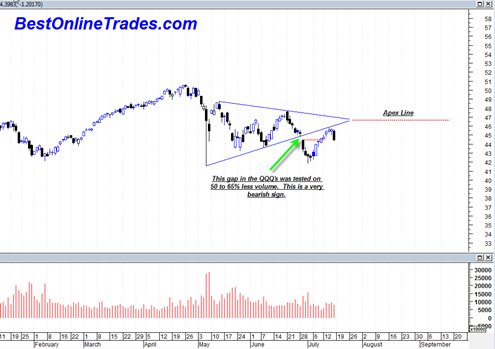
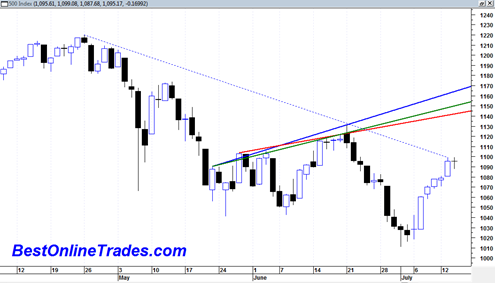
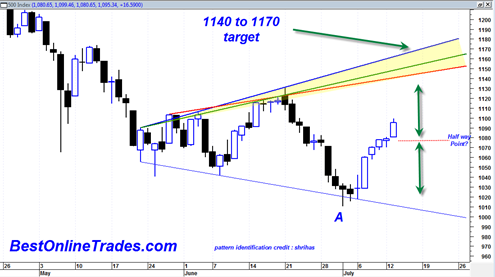
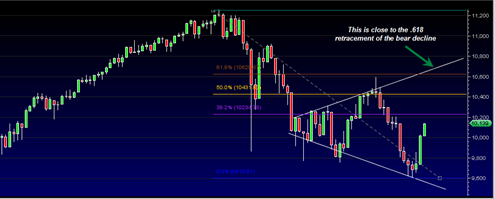
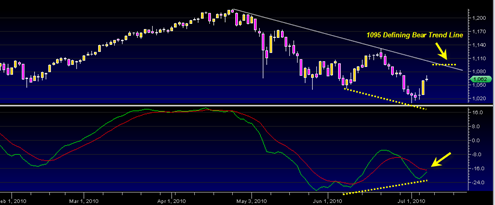
I have to say still at this point that the market character is still decidedly bearish looking. We have been making a series of lower topping formations (in the form of tower tops) that are meeting an ever present horizontal demand line. I have no clue who the buyer is at the horizontal demand line, but it looks like they are about to be overtaken quite soon.
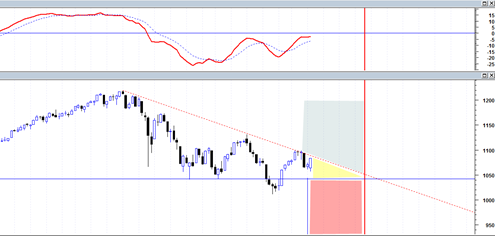
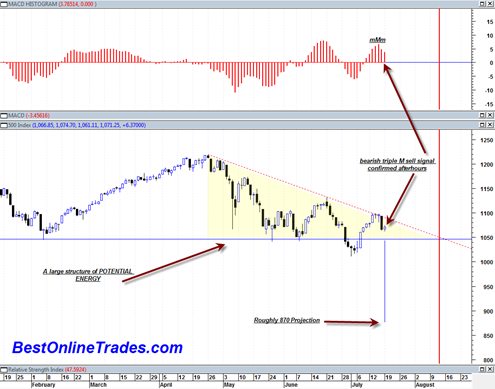
The current structure of the entire market as represented by the sp500 since end of April has now shown a very clear descending triangle. Perhaps this is one of the most under rated patterns out there in the technical analysis field. I rarely see much discussion of it. But that is actually a good thing. I would rather not have the whole world discussing it as it would then probably fail. The mainstream financial media both online and offline seem to mostly recognize the head and shoulders patterns. Perhaps that is why they are failing more often now than in the past. At least it seems that way.
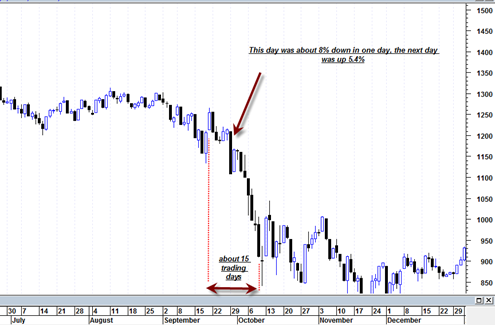
But anyway, this descending triangle has a rough measurement towards the 870 level. A lot of energy has been built up in this structure and it should lead to a big one day move. But as is typically the case, there are likely to be a lot of big individual swings that mark the entire decline. This market has had a pattern of making very large swing trading ranges and I don’t see any reason why it should stop now even if we do get a big one day move down.

