Nikkei Crash Today Similar to May 6, 2010 sp500 Crash

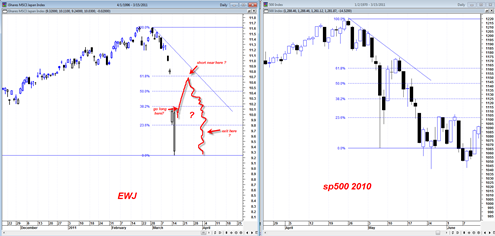
There was a huge huge trade that I missed today unfortunately and also was not quick enough to write about it.  The trade was going long the EWJ (Japanese Nikkei ETF) right near the open today.

The EWJ opened down in crash fashion because of the overnight drop in Nikkei Futures.  The opening in the EWJ ETF was so extreme that it had the daily RSI at a record record low point perhaps near a value of 10 RSI, not only that but the EWJ also opened right at a strong level of support from the June July 2010 time frame.  This morning was a huge opportunity to go either long the EWJ or long some March or April call options on the EWJ for potential 100% to 500% profits by the end of day.

Certainly based on the news it would have appeared that the EWJ was an extremely high risk trade with the nuclear and earthquake fears, but in actuality this is one of the lowest risk trades one can take in my opinion.

You had washout blow out panic volume, massive oversold RSI and opening right near an important support range.

I think it is quite fair to describe the recent 5 day move in the Japanese Nikkei index a crash in terms of the speed and magnitude of the decline.

So the lowest risk trade was near the open today, but there may still be a chance to trade the EWJ as it is now still in a very high volatility cycle and we should see huge swings in both directions.  But I would say that now the trade becomes much more dangerous compared to this morning’s trade.

Read more

Nasdaq Composite on a Date with Destiny

This may be one of the most important posts and charts I have posted in a long time. Market index analysis has a habit ( at least to me) of being MOST of the time fuzzy around the edges.  But occasionally it starts to crystallize into a clearer picture and better form that helps build confidence on a certain forecast.  It is a matter of making speculative forecasts, trying to identify key levels and then attempting to see whether the tape action starts to confirm your own forecast.  If it does not then one must change tack and work with alterative scenarios.  It is always good to have a small handful of scenarios to work with, both bullish and bearish otherwise it may leave you in a vulnerable position.

The current market is akin to a 200 car train that has no braking ability.  It is sheer price force and momentum and this is to be respected and acknowledged before anything else.  Having said that, it is also well known that no market can continue to go vertical forever.  There must be a pause so that the market can form a pivot point for a new base that can eventually push the market higher.  Markets build cause and then use it up.  When they are done using it up, they need to build new cause.  Of course after being in a market that seeming only goes up, it is always EASY to forget about any necessary looming correction.

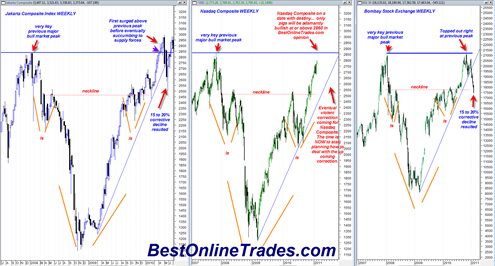
I have been picking on the nasdaq composite a lot lately and for good reason.  The nasdaq composite index is approaching a key level that represents the start of one of the greatest bear markets of all time.  This level was of course the late October 2007 peak in the market that preceded a long duration persistent trend bear market.

The key with the Nasdaq is the issue of how this 2007 peak will be dealt with?

  • Will it simply be exceeded and ignored ?
  • Will it turn on the exact tick of the previous 2007 high at 2861.51 ?
  • Or will it AT FIRST be exceeded and then eventually succumb to supply forces at a later time?

Unfortunately we will not know the exact answer until it actually happens, but we can come up with some scenarios and attempt to get a better feel for the market as we approach this previous all time high level.

Read more

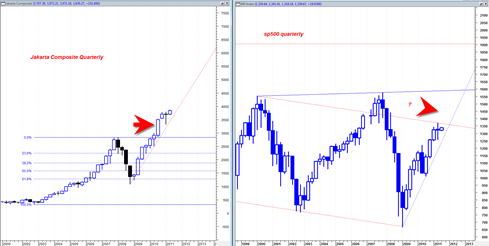
Does it Seem Unthinkable to Consider Being Bullish into 2012

The bullishness is simply astounding lately.  It is remarkable.  Undeniable at this point.  It seems like we are up almost every Monday of the week, every Friday of the week and most days in between.

So that must mean we are overbought and ready for an extended nasty decline that will be horrible and scary right ?

Not necessarily.

Yes sentiment is at extremes, technical indicators are at extremes and it really does feel like at least a minor or intermediate pullback is way overdue.  But my take going forward continues to be that the market will keep trying to frustrate the heck out of those who wish to short it.

I tried to short this market several times since October 2009 and most of those attempts failed.  The only one that succeeded was the one in October 2009.  I was lucky to catch that mini decline.  But all the other attempts failed.

Why did they fail? They failed because the primary trend is still very strongly up and in that type of environment every pullback is generally weak and the strong upward trend is eager to reassert itself.

The issue now is what should your general 1 to 2 year trading bias be? Is it even possible to have that long a forecast?  Generally speaking the farther you go out in terms of time, the more difficult it is to get a handle on potential price bias.

Unless…

Unless you have some very large patterns to work with or some other major market clues ( such as foreign indices or commodities ).

Read more

Shanghai Composite Index is Booming

shanghaicomposite

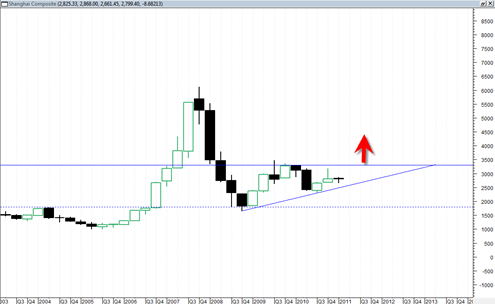
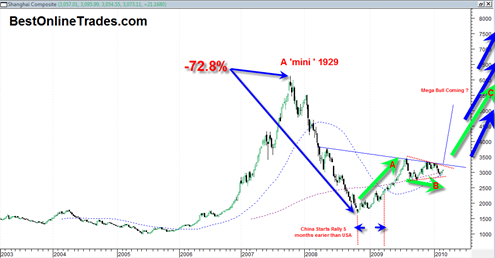
I think the 500 billion plus economic stimulus package that the Chinese implemented is working, not just working but working really well.  Just take a look at the Shanghai composite Index.  The rebound recovery rally in the Shanghai composite started about 4 or 5 months earlier than the USA’s recovery rally as measured by the SP500.

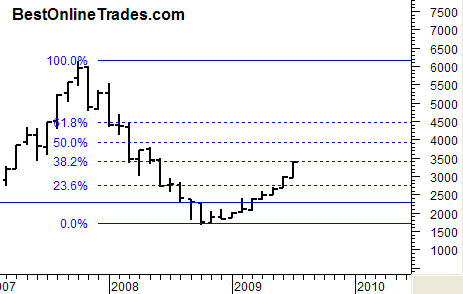
So far the Shanghai Composite is up about 104% from the intra month lows in late 2008.  Wow.  That is pretty amazing how far this index has come and how fast.  It has me thinking that if this index continues powering higher up and through the 38.2 fibonacci retracement level there is probably going to be a mad panic rush to China stocks.  Of course there already has been plenty of activity in Chinese stocks, but it could go into overdrive with the cooperation of this index.

Read more