SP500 has Valid Breakout but Approaching Top Line Resistance

spy20090724

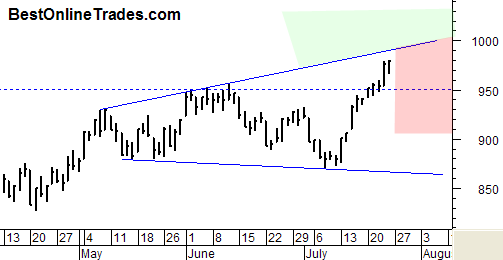
The SP500 had a clear valid breakout yesterday on confirmed volume according to the numbers that I look at.  Yesterday was a ‘sign of strength’ and it was what we needed to see to make this a valid breakout above the 950 level.

I can tell you flat out that one of the most common pieces of price action I have seen over the years which happens almost with spot on regularity is the retracement of price right back to the breakout level.  In the case of the SP500 that would be near the 950 level.  So if we can get a retracement back to that area on low or weak volume it would be an ideal scenario of going long as long as that support holds.

Read more

SP500 Index Trading Update

The short term sell signal I was talking about yesterday seems to be a wrong signal.  Perhaps I was splitting hairs too much.  It is still early, but the market is powering higher in what appears to be a sign of strength over previous resistance that exists in the late May to early June time period.

So I have to respect what the market is saying at least as of right now and am going to change the short term signal to long again.  This market wants to move higher and this move may be faster than many expect. 

I would like to add either the SPY or the SSO (SP500 double long ETF) to the BestOnlineTrades Recommended list but I would rather wait for the first pullback from this rally before initiating.  I hate to chase it after almost 9 days straight up.

It is still going to be interesting to see what kind of volume we get on this breakout today and if price can hold the breakout at the top of the range.  So far this looks like a sign of strength early today but we will have to see how things look by end of day.

Anyway, to summarize, the broad market has invalidated my short term sell signal I had yesterday.  This market wants to power higher.  The nature of this rally should be quite persistent given the modest retracement that occurred from the May to end of June correction.

Read more

SP500 Confirms swing test with Adequate Volume

This is a follow on update to my previous post during mid day where I was talking about an important volume swing test that the SP500 was doing today.

The comparison is between the 6/11/2009 price swing on the SP500 which had an intraday high of 956.23 on volume of 1,222,768,700 (NYSE Volume).  Today we tested that June 11th swing high on the SP500.  Today’s high was 956.53 and today’s volume was 1,207,021,284 (NYSE Volume).  The close on the SP500 today was 954.21 so we ended up closing below the 6/11/2009 swing high.

It was a successful volume swing test because the volume today was only about 1.3% less than the 6/11 swing high, so we are within 3% which is enough of a signal and indication to me that the market can continue higher from here.

Note that we did close under the 6/11 swing high.  So the volume test was successful but price did not manage to close above the swing high.  So it says that we could base around here at these levels for a bit or even do a pull back to the previously mentioned heavy volume gap on the SP500.  But even if we pull back from here at the top of this trading range, the market is still saying based on volume that it will ultimately break these swing highs.

The Nasdaq, or the QQQQ as a proxy for the Nasdaq is leading the way to the upside and has already broken the horizontal swing point levels.  So that is a hint in my opinion of what is to come for the SP500.  Clearly the Nasdaq is the strongest index out there right now.

It is pretty amazing to me that this possible upside breakout is developing right as we sit here before August, traditionally one of the lowest trading volume months.  But regardless of the seasonality, we must respect what the price and volume is telling us.

Read more
SP500 is on a Mission to Trendline

sp50020090717

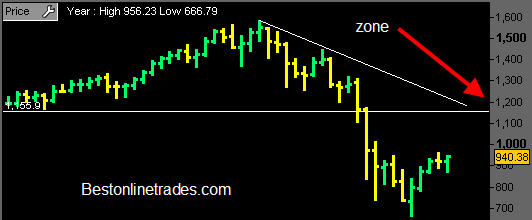
I am starting to become OBSESSED with this monthly chart of the SP500 (Gee I need a doctor!). Ok I am just kidding, but still this monthly SP500 chart is very important for several reasons.

For starters, it defines in one clear view the entire bear market we have been in since 2007 and it shows with good clarity (the white down trendline) the defining line of this bear market and the hurdle that needs to be overcome to change the long term outlook.

After staring at this chart for a while I can tell you that my sense is that the white down trendline really looks like a magnet to me.  I really think we have a good shot at between 1100 to 1200 on the SP500.  As far as timing… hmm well maybe by early next year? Maybe a little bit sooner.

So far the MONTHLY price bar for July is looking pretty good.  Now if we can end the July Monthly price bar so that it looks similar to what is shown in the chart above then I think we could be looking at quite a running market into the end of this year.

Read more