S&P500 Index has Possible Short Term Bearish Divergence

spy20090824

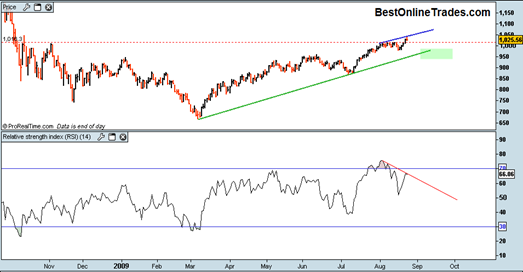
The S&P500 had an intraday reversal today and price closed near the opening price creating a reversal hammer on the candlestick chart.  But perhaps more significant than that the S&P500 created this reversal hammer early in the week and has created a possible short term bearish divergence between the relative strength index and the S&P500 closing price for the month of August.

There are only 5 days left in the month of August not including today and it has me thinking some sort of correction may start here.  The follow through sign that a correction will continue is if the relative strength index fails to make anymore upwards headway and if the SP500 breaks down below minor support near the 1014 level.

Read more

Emini S&P 500 Futures Down Significantly this Morning

sp50020090817

The Emini S&P 500 Futures are down by over 20 points this morning.  That is the most I have seen them down in the morning for maybe the last month or so.  So it seems we could finally have a real correction to the downside kick in during the last two weeks of August.

I am still seeing a decent amount of upside setups, but this possible downward bias in the S&P 500 the next couple of weeks is worth noting and probably makes it prudent to be more defensive and shorter term the next couple of weeks.  There may be more failure breakouts and continuation breakdowns in individual stocks and the indices for the rest of August.

Read more

Nasdaq QQQ Blasts Higher today on Robust Volume

qqqq20090812

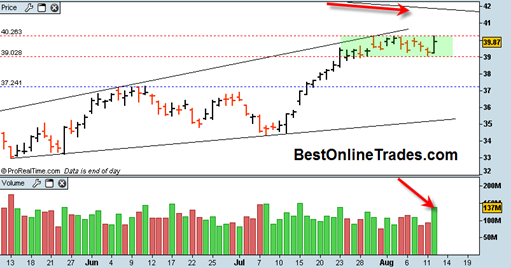
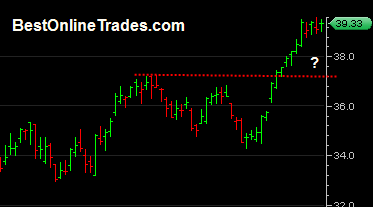
The move today in the QQQ was pretty impressive.  It was impressive in the sense that the bears should have been able to break under the green shaded rectangle and get the much awaited correction going, but the exact opposite ended up happening.  The upside volume was 137 million shares and is a solid way to get a bounce going inside that rectangle. 

This rectangle is depicting internal market strength once again to me and hinting at an eventual possible breakout above this rectangle to towards the 41.5 level which is right at the point of the long term bear market resistance line.  Perhaps we get a retracement the next could of days and then a breakout out of this rectangle next week sometime?

It is almost mind boggling that we are getting this strong price advance and this robust volume at this point in August.  It would seem that traders are in no mood to hit the beach this year.  They would rather be in front of their computer screens. Hmm.

Read more

SP500 about to get a Bullish Monthly MACD Buy Signal

sp50020090811

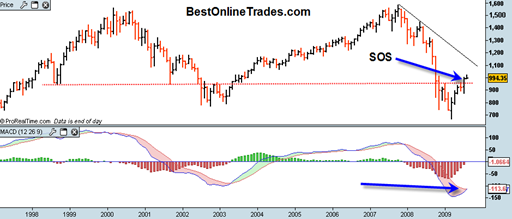
The SP500 is about to get a bullish monthly crossover on the MACD indicator, a popular moving average combination indicator that can become very useful over longer time frames.  The monthly MACD signals can signify new major bull or bear market moves with sometimes 1 year or more duration.

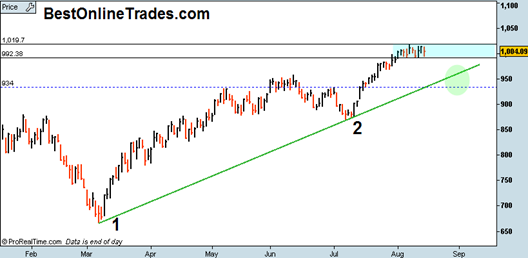
The current daily MACD signal is starting to flash some near term sell signals and could set us up for a move to test the 940-945 range on the SP500. 

It is confusing sometimes when you have a sell signal on one time frame and a buy signal on a different time frame.  To help clear the confusion, I always keep in mind that the longer term time frames have precedence over the shorter ones.  So while we could get some selling pressure into 940-945, we must remember that the longer term signal is indicating higher prices.

Read more

Three Important Charts S&P500 Nasdaq Composite and the QQQQ’s

sp50020090805

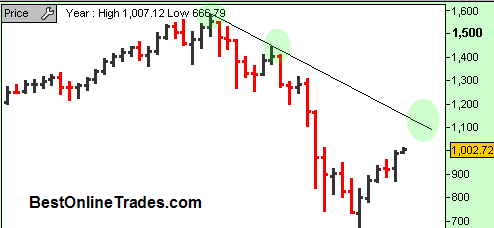
I have three important charts to share with you that could help to clarify where we are and where we might be going.   These charts are pretty much self explanatory but I still believe they illustrate important points or guideposts if you will for future market action. The first is the S&P500.

You probably know already what I am going to say with respect to this chart.  It is the monthly chart and it shows the powerful move up in July and now the follow through bar for August.  Clearly the August bar is just beginning but you can see we seem to be on a mission to the down trendline of the bear market that started in late 2007.  Now before I say anything more about the S&P500, lets look at the other two charts first.

Read more

Powershares QQQ Trust does not want to Retrace

Today the powershares QQQ Trust, symbol (QQQQ) tested the gap from yesterday on about 25% less volume.  It has become clear to me at this point that any decline we get from here is going to be labored and lacking in conviction.

I still think 37.20 is fair game for a target on the QQQ Trust in August, but there are a few reasons why this may be delayed short term.  One of the reasons is the US Dollar index, which broke down badly today.  I am going to write a post on the US Dollar in a moment.  A declining US dollar is supporting higher prices in the broad market.

I should also mention that major topside resistance on the QQQ Trust comes in near the 42 and change level.  That level represents the primary bear market trend that began way back in October of 2007.  It is in my opinion a very significant level and one that we will be watching closely going forward. At the current rate the QQQ is travelling, we might just get there within a month or two.

It seems almost a foregone conclusion that this level will be tested.  The nature of the test on the weekly charts is going to be very important to watch.  If we see price bump its head on that down trend and have a fast reaction down, it could be a warning sign that the down trending resistance line will hold and not be broken.

On the other hand if we see price hug the bottom of that resistance line for say a month or two, then it could be a bullish sign and we might see a massive upside breakout through that bear market force.

Read more

QQQQ has a Non Event Day

qqqq20090729 Yesterday I was talking about how I noticed a confirmation sell signal on the QQQQ’s based on price and volume.  But today we really don’t seem to have confirmation either way. Volume was slightly higher on the Q’s but as far as price goes we did not test either the high or low of yesterday so we really don’t have much new information to go on.  Today is considered an ‘inside day’ since we stayed within the low and high of yesterday.  Tomorrow, if we again stay within the low and high of today, then that will be a ‘double inside day’ and would be a sign that a big move is coming.  Confused yet?

But seriously, double inside days can lead to big price moves.  They problem is they do not give a directional indication, just a general signal that a big move may be coming.  But since we don’t have a double inside day yet there is nothing to go on.

The market in general seems very reluctant to give any price back despite my signal for short term bearishness.  Perhaps it is not surprise since we are really getting close to super low volume summer doldrums season coming up here in August.  I suspect that if we do get a pullback in the next week or two, that it may be really quite a lame one.

Read more

SP500 Index Starts a Retracement

sp50020090728 The SP500 looks like it wants to get a retracement going.  Currently I am thinking somewhere near the 950 level as I mentioned before being minor support and normal in the sense that often one will see price retrace right back to the breakout area.

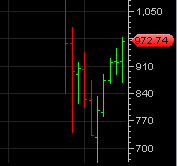
Also under consideration is the fact that we are only a few days away from the end of the month of July.  The little chart to the left shows monthly price bars on the SP500 index.  So the next opening price and initial price action for August will soon be printed on that chart.  It is possible, but unlikely in my opinion that the opening and continuation price for August will just easily continue at and above the 972 or higher level.  So instead I think we should see more of a retracement into the current July price bar for maybe the last few days of July and and then some days into August.  Then after that is complete a resumed move higher.

I am also noticing at least the possibility of a bit of a US dollar bounce upwards and that could stir some headwinds on the SP500 shorter term.

A modest price pullback during this time of year would not be extremely unusual.  We already know that the SP500 was able to make a valid break of the recent highs with adequate volume, so a retracement starting now is not the end of the world.

Looking at a price chart on the monthly scale has been very useful to me recently when you look at it in the context of what kind of range the next succeeding price bars will have.  It helps to quantify what the probabilities of the next price move is.

I should add also that if the SP500 were to continue upwards at the same rate as the last two weeks then we would quickly be close to SP500 level of 1100 within the next 2 weeks which seems highly unlikely, though not impossible.  So the upwards rate of change just got a bit ahead of us here.  So now I believe we will be in retracement mode. We shall see.

Read more