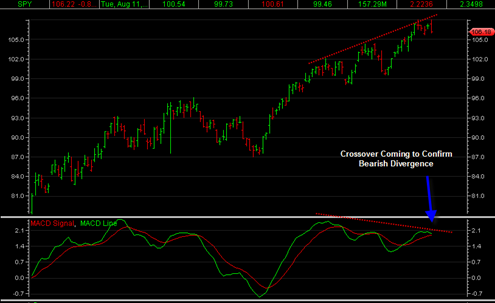
The SP500 Topped Today and it is Time to be Bearish

spyetf20090923 The market topped today in my opinion and caution is advised for the next few weeks as I think we are in for some pretty severe downside.  There were plenty of significant reversals today and it looks like the SPY ETF showed a bearish engulfing candlestick pattern on heavy volume.

The structure of the market right now is still setup in a bearish divergence when we compare it to the pattern of the MACD.  It says that we should now have at least a month of downside price action with a few intermittent rallies in between.

Almost everything reversed today and a lot of the indices look bearish now whether it be stocks or commodities.  There are bearish divergences all over the place.

Read more

SPY ETF Working into a Top the Next Several Days ?

I have gone back and forth with my bullishness and bearishness on the broad market recently.  I just think it is important to be prudently cautious at these levels. There is supposed to be an important astro aspect early next week that may stop this market dead in its tracks and case the long awaited … Read more

What I saw In Gold and the SP500 Today

The SP500 closed right near the highs today but the volume was lousy.  I have to say this is a pretty amazing accomplishment given that it is a lazy Friday right before a 3 day holiday weekend.

The gold price also barely pulled back today and managed to close slightly positive on the daily basis.  This is a very bullish sign on a near term basis and says to me that the gold market could get some significant continuation next week.  The longer we hug the recent highs without pulling back that much, the more bullish potential we have for the long awaited break over 1000 !

But there is talk that the broad market is supposed to tank big time next week. I can see this as a possibility when I consider the huge downside volume that we had 3 days ago in a serious sign of weakness.  Yes we bounced higher today and closed right at the highs but it was on barely any volume.  It was all smoke and mirrors.

But I do have to respect the fact that we bounced off of support and now are bouncing back topside.  It just seems like the bears should have been able to accomplish more downside this week but they couldn’t get it done.  If they can’ t get it done next week then it could very well be that we are headed for more super bullish upside prices.  In a previous more longer term post on the sp500 I mentioned a scenario where this could be possible.

If this market is going to get a serious downside correction then I would think we get a gap down on Tuesday in the AM and then just slide down from there.  If we are still drifting around next week, then I am going to become more and more skeptical of the ‘super duper correction’ in September scenario.

Read more
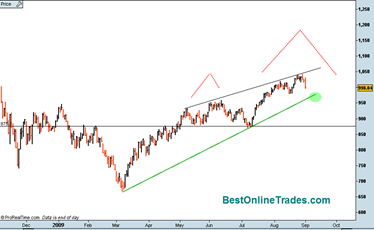
S&P500 Finally Starts a Real Correction

sp50020090901

There is no doubt about it, the SP500 finally started a more serious correction today.  It was able to evade this correction for all of August but the shorter term bearish divergence was hinting that some sort of down move was in store.

You can clearly see from the chart that the SP500 is confined by the longer term green up trendline and the top black channel line.  It appears that we want to trade down now and test the bottom of this channel.  It is going to be important for that green up trendline to hold price during the month of September otherwise it could warm of a more involved correction that may see us trade down to the 870 range. 

But for now I am going to assume that the green up trendline holds support.

I also sketched in a couple of red lines on the chart pointing out the possibility at least that a somewhat large head and shoulders topping pattern may develop if we continue to correct down to 870 on the Sp500. 

Read more

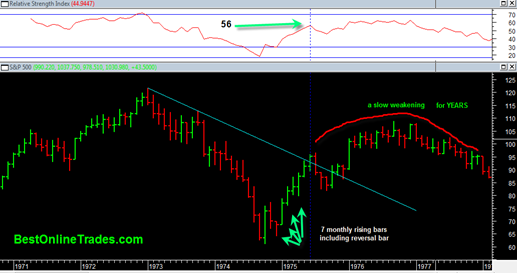
I Can See the Future and it Looks Like the 1974 S&P500

1974monthlysp500

I don’t have a crystal ball that tells me what is in store for the future.  But the closest thing to a crystal ball that I have found so far is the 1974 time period of the S&P500.  The entire structure of the market during the time frame of 1968 to 1982 has given me a lot of good perspective and understanding about our current market and has helped to give me great clues and better confidence about where our current S&P500 may be headed in the future.

Now you may be asking yourself, what on earth does 1974 have to do with today ? Nothing actually.  But what I have found over the years is that sometimes past market movements tend to rhyme and show similar structure and trend development.

Read more