The Stock Market Will go Up in a Straight Line in 2010

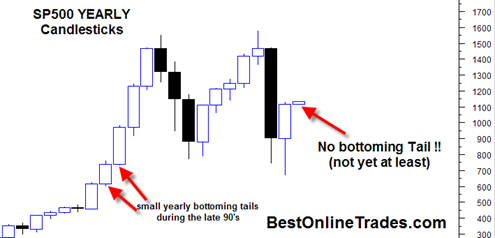
I am kidding of course, but I had to write a catchy title for this post given how we are starting the first day of the new year in the market.  I find it very significant that we ended the 2009 YEARLY price candle only inches away from the high of the YEAR.  And now on the first trading day of the YEARLY 2010 price candle we are in a gap and go situation.  That is an extremely bullish type of candlestick behavior because it does not create any ‘bottoming tails’ on the lower portion candle.

It is true that we can still see some type of selling the next week or two that will create

So far at least we see a huge sign of strength today across the board.  Even the financials (XLF) are rallying after that very long consolidation pattern which could have been seen as a major topping pattern.

Obviously I was stopped out of my TZA position this morning.  And at this point I have decided not to go short again later this week.  In fact I am looking for long side opportunities again. 

One just has to respect the bullish tendencies of this market.  So I think finding long opportunities is the early game plan again for now.  But at the same time being aware that bullish sentiment readings are at record levels and make the long trade a very crowded type of trade.

sp5002010104

Read more

SP500 Set Up for a Wild Monday and First Week of New Year 2010 ?

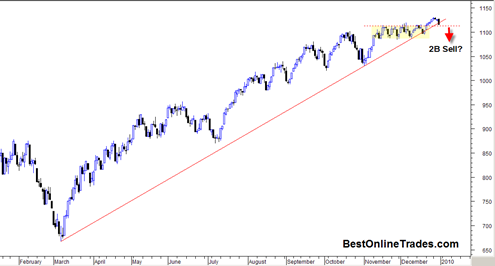
The charts are saying that this first week of the new year 2010 has the potential to be quite a volatile week.  I am considering the possibility at least that we finally get a meaningful hard down week this first week of January or at least start to see a lot more volatility as compared to last month.

The bollinger bands on the SP500 have contracted into a very narrow band over the last month but they have started to slightly expand.  I suspect that the volatility expansion is going to be to the down side, but a lot really depends on how we close Monday, the first trading day of the new year 2010.

Looking at the uptrend line that has defined this bull run since March 2009 we do see that the SP500 is once again sitting on this uptrend line and at risk of breaking down and through it. 

sp5002010103

Read more

The Short Side of the Market is Not Working

My little experiment at trying to pick another top in the market did not work.  I dumped FAZ and will now stay on the sidelines and look for long opportunities in stocks and/or ETFs again, but very selectively of course.

I said in my previous post that we really needed to see the market do some real damage to close this week out to keep a nasty bear trend going into next week.  But it did not happen at least 20 minutes before the close today and now it is looking like the complete opposite will happen.  A continuation run in the markets that may even accelerate into new year time frame and beyond.

We are now piercing on the SP500 ABOVE the 50% fibonacci retracement level of this entire bear market instead of breaking down and failing below it.  In addition the WEEKLY MACD sell signal I had mentioned some time ago has turned into a failed signal and the market has once again evaded a possible bear trend signal.  This is the same type of thing that occurred in the 2003-2004 period were the weekly MACD kept repeatedly failing time and time again and the market just kept doing very small 2 to 4 % corrections but then just kept trending higher and higher, although it was flat for quite some time too.

We may enter a similar type scenario next year, where the market does have corrections but they are never more than 3 to 5% and the market moves still in a more modest uptrend and then sometimes long sideways trend.  That type of market environment would make it very difficult for bears to get large amounts of ripe fruit so to speak and it would probably be extremely frustrating over the longer term for them.

Read more

SPY ETF Shows some Possible Ominous Bearish CandleStick Patterns

SPY200910172009

There are only about 8 real trading days left until the end of the year if you exclude the days around Christmas.  So that means about 8 trading days to create the final YEARLY price bar close and then start the next one for 2010.

The market has powered up so fast and so persistently in 2009 that one would think people would take at least a few points of profit and capital gains.  For us to close the 2009 yearly price bar only a couple points from the yearly high seems improbable.  Just like on a daily price bar right before 4PM you see day traders exiting, I think we could see similar type price behavior going into end of this year.

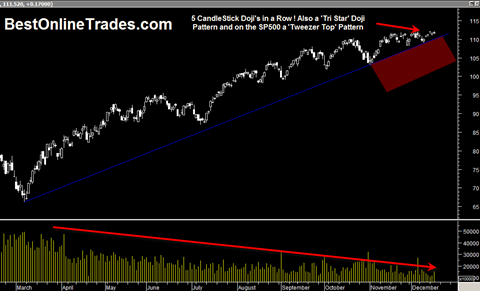
In addition I should also tell you that I have noticed some OMINOUSLY bearish looking candlestick formations in recent days on the SPY ETF and DIA ETF and also the SP500.

Read more

SP500 Yearly Candlestick Chart Shows Bullish Bottoming Tail and Range

sp500yearly

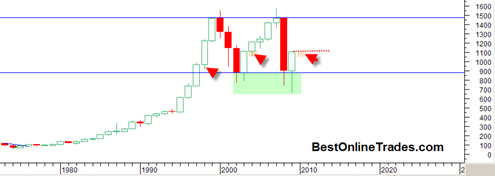
This is a very interesting candlestick chart of the SP500.  It is the YEARLY price candlestick long term chart.  There are few interesting things we can see from this chart.  The most obvious is the very clear long term trading range almost 10 years long.  Despite all the bears endless preaching the fact is that so far at least the market has not been able to break DOWN out of this trading range and therefore keeps the cause building consolidation case intact.  The longer the market trades within this large trading range without breaking down under 900, the better argument can be made that eventually it will break topside.

The other thing to note is the current 2009 yearly candlestick.  This massive yearly candlestick has a large bottoming tail which indicates the strong demand that came in and held prices within the trading range.

Read more

Is the Next Major Top in Gold and the SP500 Really Going to Be This Simple ?

euro20091202

usdollarindex20091202

A lot of market analysis sometimes boils down to some very simple analysis.  But we humans try to make market analysis as sophisticated and complex as possible to make ourselves look smart and feel important.

But could it be that the next major trend change or at least consolidation and retracement be due to the two simple charts above?  I think it could very well be.

The Euro is trending higher on a solid up trendline and appears to be close to the point of some type of final blow off run into that red zone I labeled in the first chart above.  Conversely the US Dollar appears to be headed into that red zone of support, perhaps also in ‘blow down’ fashion.  When either the Euro or the US Dollar Index hits those zones I would logically expect some type of big downward bounce in the Euro and upward bounce in the US Dollar Index.

When they get into those ranges I would think the powers that be (central bankers worldwide) would start making a lot of noises that their currencies have gone ‘too far out of line’.  So that type of thing could cause some huge bounces and break downs and it will probably coincide with them hitting those red zones above.

Read more

Another 5 to 7% Drop for the Dollar or 5 to 7% Rise for the Euro

There was a great article by Kathy Lien over at moneyshow.com where she makes the forecast and argument that the US dollar could drop another 5 to 7% and that the Euro could conversely rise another 5 to 7%.

The reason this article is important is because the almost perpetual and persistent advance in the SP500 has derived a lot of it’s energy from a slow and gradual falling dollar.  Gold and commodities have also benefitted from this trend especially in the current near term time frame as it appears the gold price is moving into the parabolic stage.

But the main point of the article that I find key is the perspective that currency moves tend to be quite persistent and not that likely to change direction once a firm trend is in place.

She identifies this 5 to 7% range of advance (in the case of the Euro) and 5 to 7% decline in the case of the US Dollar Index and it is interesting to note that those levels correspond to the Euro hitting the resistance level near its previous major high and the US dollar hitting the support level of its all time low.

Read more