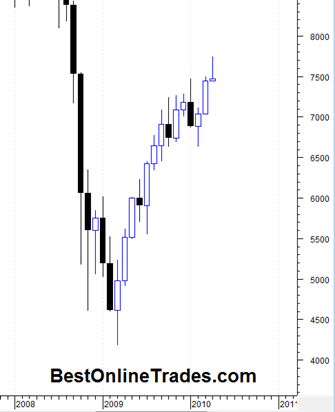
New York Composite Index Reveals a Monthly Gravestone Doji

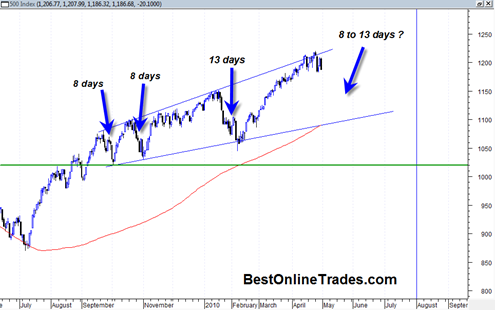
If you have been reading posts here at BestOnlineTrades then you probably already know that I am ‘looking for’ a price movement that has less resistance on the downside rather than upside (note: I am purposely trying to avoid using the terms ‘bearish’ or ‘bullish’ because of the inherent emotional bias it can build in … Read more

Stock Market has Switched into Overdrive

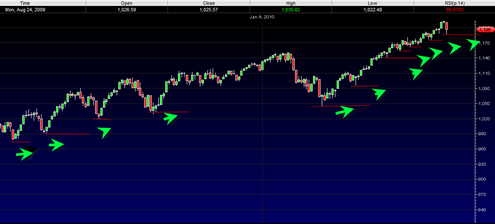
The market has switched into total overdrive with the weekly RSI reading currently showing 72.62 above the critical 70 line.  BestOnlineTrades has been correct in maintaining the stance that this reading should be perceived as internal market strength and not a sudden reason to short the market.  The path of least resistance remains up and … Read more

Market Tops are not Made in One Day but Market Bottoms Are

Today is another interesting day on Wall Street.  The Arms index hit a high today of close to 3.65 and tells me that today’s decline is most probably a one day oversold type event.  The market was very clearly in heavily overbought territory and very overdue for some type of pullback.  And so when any market gets in such a severe overbought level the smallest piece of news can be enough to get a big correction going.

How we close today will still be important as a setup going into next week.  If we close near the lows today then it could be a sign that next week will see some downside follow through.  On the other hand a decent end of day rally today may set the stage for a bounce next week to work off this oversold situation right now.

It is possible that this is a more significant top, but we will probably need another attempt at the highs for better confirmation.  So far the SP500 is still trading in a higher highs and higher lows type situation and until that changes I give the benefit of the doubt to the bulls.

Read more

This could be a very important Market Timing Chart and Signal on the QQQQ

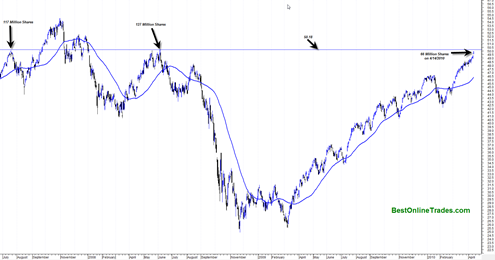
I just loaded up a longer term chart of the QQQQ Nasdaq tracking ETF (PowerShares QQQ Trust, Series 1) and I found a couple of potentially important clues.  The clue has to do with the current level the QQQQ is at right now and where it is situated relative to two other very important peaks.  It also has to do with the volume level at those peaks and the current volume at present day.

Nine times out of ten (my own approximation) whenever you have a stock or index reach a previous key peak level in the market, there is usually some type of retracement for the simple reason that previous holders want to get their money back.  Another reason is because technicians are also watching these levels and use it as an excuse to sell.  And a final reason is the quality of the volume test because in volume analysis you need volume that is within 3% or greater of the previous highs volume for there to be an eventual successful breakout from that level.

The chart of the QQQQ as shown below indicates that it is only .54% away from testing a very key previous resistance level both in terms of price and volume.

qqqq20100414

Basically we are within ‘inches’ of this key level.  The key level on the QQQQ is 50.18.  This is a key level because you can see from the chart the two previous key price peaks were generated at this level and they were relatively sharp peaks.

Read more

Market Bullish Tendencies Keep Rolling on

The market is zooming right into April and the previous monthly MARIBUZU (almost a maribuzu) candlestick is so far evolving into anther maribuzu candlestick for April.  The market is strong. There is no denying it.  The WEEKLY relative strength index is getting close to busting into the 70th percentile powerzone which is a rare but … Read more

I can come up with a Million Reasons why the Market Should go Down

But the problem is I am just a tiny water droplet and the market itself is an entire ocean.  The market could care less what I think and it will do exactly what it wants to do on its own time.

I have done a number of posts on what appear to be good reasons for a near term bearish resolution in price behavior for the sp500 and most other major broad market indices.  But despite that recent bias, I have to pinch myself and at least consider a bullish possibility for the market going into the long Easter holiday weekend.

By many measures the market is overbought.  But a market just being overbought is sometimes not enough of a reason for it to decline.  It can continue into ‘tilt mode’ overbought before any meaningful price reversal occurs.

The jobs report is coming out this Friday.  There will be no trading that day.  So whatever the results are of that report will have 3 full days to build up and stew over the long weekend.  That 3 day rest period before a market reaction usually leads to a very big opening move to start the following week.  And the market as of late has a very strong habit of being up on Mondays.

But everything seems to be relying on the interpretation of Friday’s jobs report.  Most of the news lately has been good news and it just seems to keep on coming, so why should this Friday be any different ?

I can speculate until I am blue in the face and will still not be able to figure out how the market will react on Monday of next week.

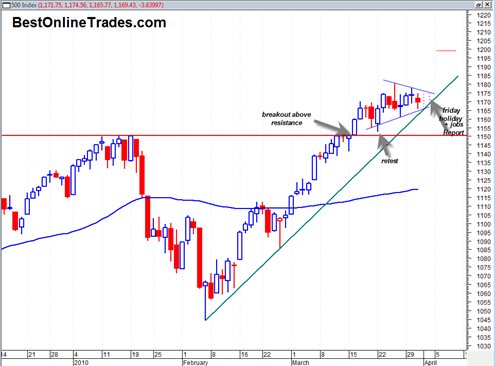
So here are the cold hard facts based on the chart:

sp50020100401 

The SP500 since early February has been in a very strong uptrend.  In early March it broke out above a significant resistance line with a moderate sign of strength and then attempted to retest the breakout area a few days later.

Read more

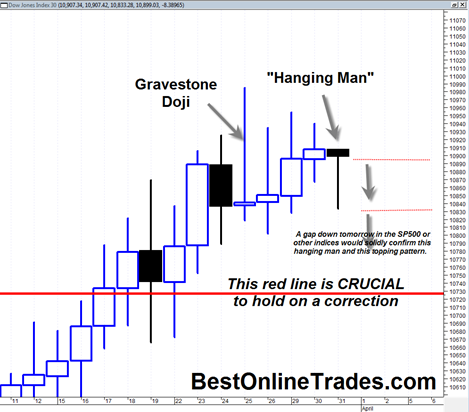
Dow Jones Industrial Average and SP500 show Hanging Man Candlestick

Breaking news development… The Dow Jones Industrial Average as well as the SP500 Index are currently as the time of this posting showing another potential bearish implication candlestick formation. The formation is the bearish hanging man candlestick.  This candlestick looks like a bullish hammer, has a small body shape and a tail that is at … Read more