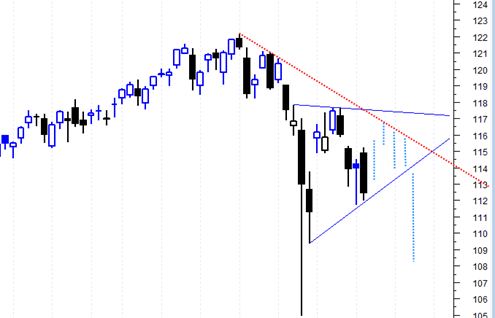
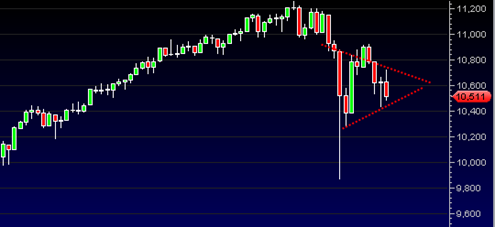
Sp500 seems like it is ready for a New Panic Cycle

The wild volatility over the last 2 weeks I think had a lot of people probably feeling like they just entered the spin cycle in a washing machine.  The market was showing huge signs of strength and then equally huge signs of weakness back and forth.  In the final analysis I think we can basically say that the last two weeks the market has basically traded flat.

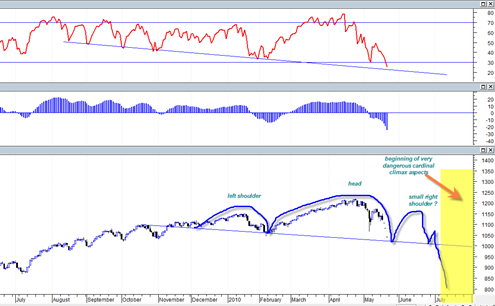
But a market that trades flat still means something.  It means the market has created sideways cause ( or energy) for the next big move.  It looks more and more like that next move is going to be down in a new panic cycle. 

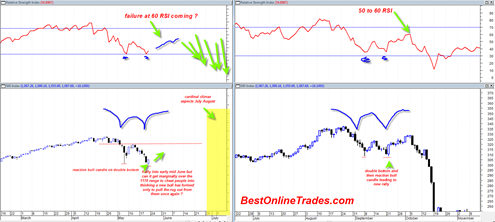
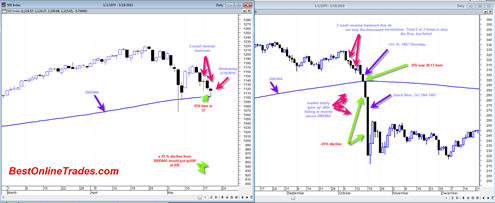
I can give you plenty of reasons why the market could still get a bounce to the 1100 to 1150 range but so far it has already tried to bounce above the 1100 and has failed.  It may try again (especially considering the extremely heavy oversold closing Arms value we has on 6/4/2010) but my instinct tells me it will just engage a new panic cycle starting tomorrow.

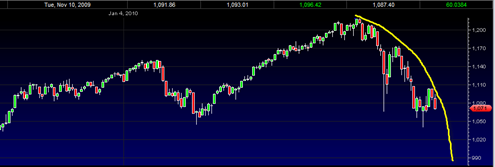
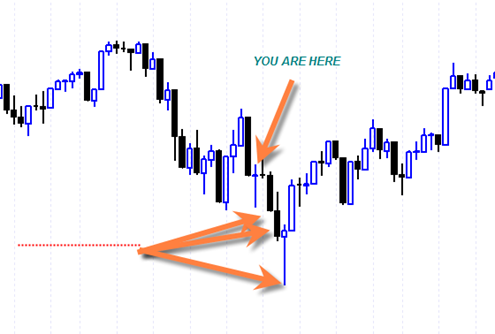
If you look at the 2/10/2009 date you will see a similar market basing period that looks quite similar to the period we are in now.  Also notable is that on that 2/10/2009 there was a similar very high closing ARMS value but not nearly as high as 6/4/2010.

Read more

The Crude Oil USO ETF trade did not work out

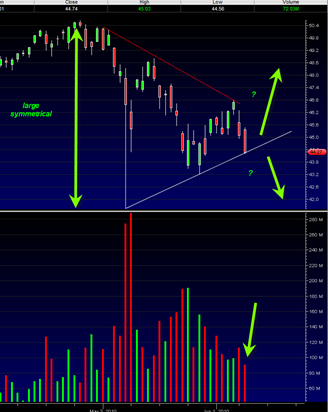
I was stopped out of the USO United States Oil Fund LP long trade I mentioned yesterday.  I think Murphy’s low applies here, what can go wrong will go wrong especially when it comes to picking spike bottoms. Crude Oil has moved into an even deeper oversold region and it could still be forming an … Read more

The Art of Tape Reading

It took me a long time to realize that it is often the most subtle signals the market gives you that have the most meaning.  The biggest challenge is figuring out what the market is ‘thinking’ at any moment in time.  Usually this is best done by looking at the indicators in combination with price itself.  I would say that probably more than half of the time, the daily price signals themselves give enough information combined with volume.  But still, that is not enough.  One has to add in a little bit of intuition and gut feel on top of everything else.  And that seems to get better with time and after looking at enough price action on many different charts.

The long legged doji candlestick we printed yesterday on the SP500 was supposed to result in some sort of northward follow through today, but it was not to be seen at all.

During the bull run between March 2009 and April 2010, it seems as though every single reversal doji like that resulted in northward action almost immediately.

Today that was not the case at all.  In fact the market in the early part of the day did get a little bit of a rally going but it was really a weak attempt.  I was looking for 1150 or even a huge squeeze all the way to 1170.  Making it to 1170 would have formed a small double top formation that would have been consistent with the initial 1930’s automatic rally breakdown and then consolidation.

Read more