sp500 Resting with 3 Doji Candlesticks

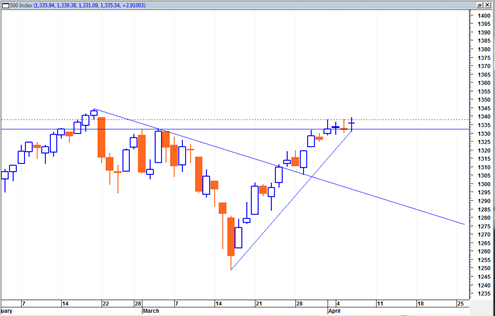
The sp500 during the last 3 trading days has printed three doji candlestick formations.  For now I suspect that these three dojis are just a simple pause in the up trend.  There has so far been now hard down reaction after any one of these dojis.

I have seen several dojis like this cluster before and at least in recent memory a lot of them have simply meant a pause in the trend describing a pattern where prices imply drifts sideways to rest and then finds the uptrend for a new move higher.

The Russell 2000 is already well into new high ground, the DJIA is trying to push to new highs and the sp500 is slightly under the old 52 week high.

I do not see anything immediately bearish about the McClellan summation index at the present time.

I can see the Russell 2000 supported on a pull back to 838 and the DJIA on a pull back to 12260.  The sp500 is still trading above the near term support of 1332 now.  Ideally for the near term continued bullish case it would keep trading above this level either sideways or only slightly down.

sp50020110406

Read more

Several Indices do Small Bearish Engulfing Today

Today several indices did a small bearish engulfing candlestick formation today.  The nasdaq composite and the SPY did, but other indices including the sp500 did not. 

This small bearish engulfing needs to be confirmed tomorrow with a close under today’s low for example on the SPY to show it is a real signal.  It does not look very convincing and we may simply be at a pause in the current mini up trend.

The most potent bearish engulfing formations I have seen in the past are the ones where the bearish engulfing candle easily closes lower than the previous day by a good margin.  This does not appear to be the case today.  It may be a head fake.

So at the end of the day the sp500 is still trading within this described ‘neutral zone’ waiting to make its next move.  It is also still trading above the mini bear down trend resistance line.

sp50020110328

Read more

sp500 Could Surprise to the Upside Again Next Week

The sp500 might surprise to the upside again next week and one very big part of the reason may be end of quarter and end of month window dressing.  There are four trading days left in the month next week and four trading days left in the quarter next week.  If the past is any guide, these last four days could have an upward bias to finish the week.

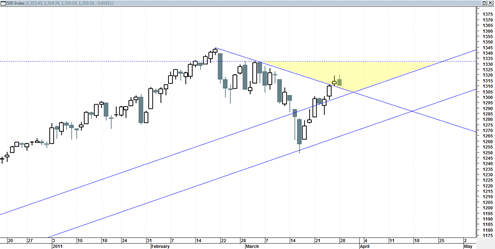
The sp500 on 3/25/2011 managed to bust back above the mini bear down trend line and was also able to trade a full price bar (both high and low) above this down trend line.  It was not a big sign of strength to end the week but it still managed to break above the near term down trend.

Right now I would describe the price action as being in a ‘neutral zone’ (the yellow shaded area below) that  is neither very bullish or very bearish.  It is still constrained within a zone of previous resistance.  The next most important challenge level is 1332.  There is likely to be some selling from that level assuming we can get up there next week.  If we do get to that point then I would look for selling to be contained within the yellow neutral zone to keep the most bullish chances for the market.

Read more

sp500 Broadening Wedge Still Forming

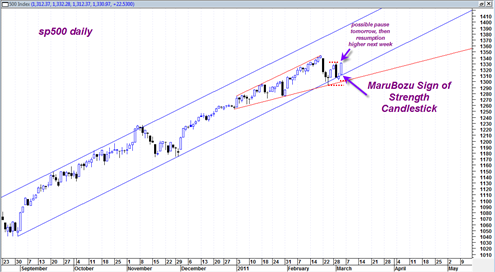
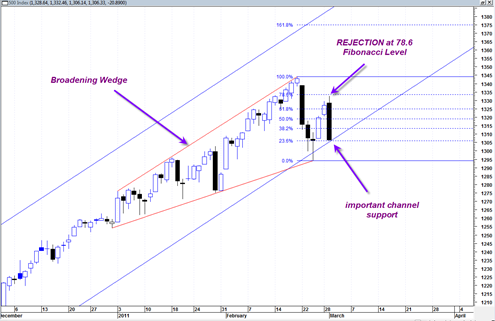
The Broadening wedge formation in the sp500 is still filling out its formation and in general I am viewing this as an eventual bearish resolution type pattern with the outside potential of it turning into a very bearish cascade type decline resolution.

Rising Broadening wedges are a very frustrating type formation because there exists an up trend and yet it is an uptrend defined by an expanding trading range which can be very difficult to identify in the early formation phase.

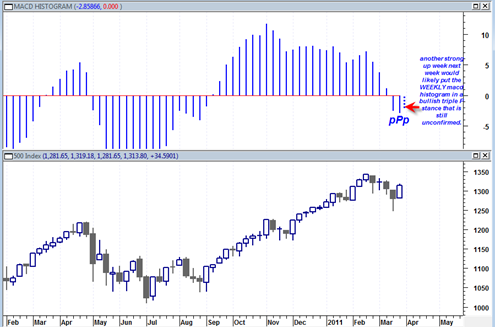
The weekly MACD and the weekly histogram on the sp500, the nasdaq and the DJIA all see to be confirming the idea that we are topping now and should get a bearish resolution out of this pattern.  I have to say that I will be utterly shocked to see a very strong (and quick) bullish resolution out of this pattern the next few weeks.  I have been shocked before, but I truly will be this time around if we see a bull resolution out of it.

There are a number of reasons why I think we will get extended bearish resolution soon:

  • The weekly MACD is almost at a negative crossover and curl over point.  Sometimes the actual crossover can lead to a bullish move, but the potential bearishness of the crossover is undeniable.  My chart work is showing that this bearish crossover should occur either by the end of this week or next week.  That should mean hard down prices soon.
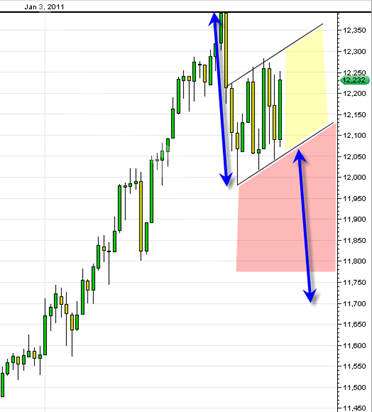
  • The DJIA appears to be trading in a violent trading range both up and down lately that defines a rising flag formation that has a clear measured down move.
  • I am seeing head and shoulder topping formations on most of the indices.
  • I am seeing 3 weekly hanging man candlesticks on the Nasdaq Composite which are still unconfirmed, however to see three of them in a row is a worrying sign.
  • The negative heavy volume versus light up volume relationships on the SPY ETF in the recent 3 weeks looks much more bearish than the consolidation that occurred in November 2010.  This time around I am seeing much more consistent heavy volume down moves that are more regular and heavy.  The up days volume is horrible.  This volume pattern suggests to me strongly that we are undergoing distribution currently (big money is moving out of the market).  Of course 200 point DJIA up days like we see today are a completely DISTRACTING smoke and mirrors situation that blinds those who don’t also look at the volume relationships.
  • If we eliminate all the points I just made above, then just the simple anecdotal point I mentioned in a previous post could be enough reason for us being at a top.  The anecdotal point I am referring to is the sub headline on CNBC a week ago that already quickly presumed in question form "on the next leg up will financials lead the way?”.
  • NYSE summation index is back in bearish trend mode.
  • High flyers such as NFLX on the monthly chart created a huge topping tail on the monthly candle and point to bullish exhaustion for some techs
  • AAPL also looks ready to start a bearish trend again.
  • The VIX volatility index has a bullish weekly trend and broke out of the long term down trend line.
  • The US Dollar so far has not busted below its long term 3 year up trend line and so far on the monthly candlestick is showing a March reversal hammer that could lead to bullish resolution for April.  If the inverse correlation with the sp500 is still valid then it supports the case of a big down move in stock market and big up move in the dollar index off of support.  Perhaps this would be related to the ending of QE and a tick up in rates to support the dollar?

Read more

sp500 Confirms Channel Support Today

The sp500 today initiated a massive rally off of the lower boundary of the long term channel support in force since early September 2010.  I have to view this as confirmation that the bullish trend is healthy and alive. I indicated in yesterday’s post that the bears really had to take some action today to … Read more

Bears Need to Step up to the Plate Tomorrow

The sp500 today did not follow through on yesterday’s power down candlestick.  Instead we witnessed a type of stoppage action and the volume also dried up considerably compared to yesterday’s SPY ETF Volume. The sp500 is still trading within the somewhat large broadening wedge formation and continues to trade within this pattern. The bears still … Read more

sp500 Decline is For Real This Time

The sp500 today was rejected very severely at the 78.6 Fibonacci retracement level almost to the exact tick.  Also notably today we bearishly engulfed the previous two days price action and closed right at the lows.  Sometimes this type of action is ending action, but in this case it looks more to me like confirmation … Read more

sp500 Closes Above Key Fibonacci Level

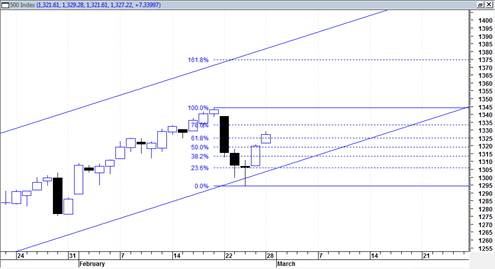
Today the sp500 closed above the key 61.8% retracement level that under normal bearish circumstances would be seen as a stopping point and reversal point for further bear market action. There is still the 78.6% retracement level that is slightly higher from current levels (about 1334), but so far the sp500 seems to be in … Read more

Stock Market at Possible Ideal Juncture for 10 Percent Correction

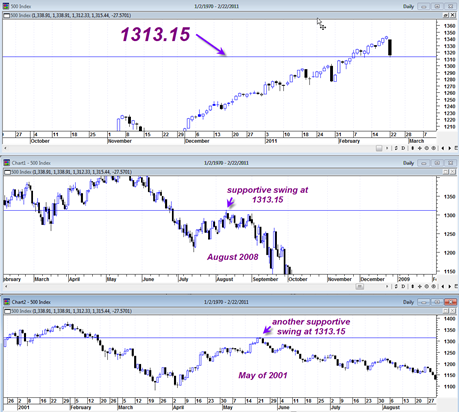
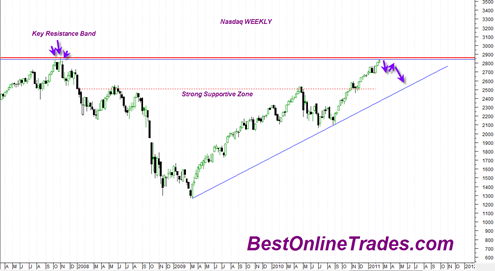
The stock market indices including the Nasdaq Composite, sp500 and Dow Jones Industrial Average may all be at ideal junctures for the initiation of an approximate five to ten percent correction. Here at BestOnlineTrades I did a previous forward looking type posting that speculated on the initiation of a correction in the Nasdaq Composite.  I … Read more