Gold Stock GSS Golden Star Resources Setting up for a Breakout

gss20090805

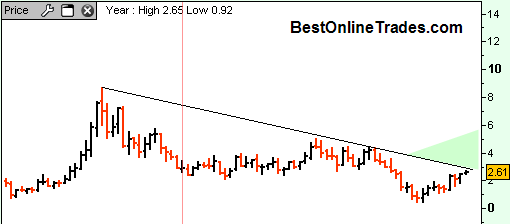
GSS Golden Star Resources may be setting up for a breakout soon.  Amazingly GSS has been in a consolidation since December 2003 !  I don’t know about you but that is a LONG time in both regular time and trading time!  GSS is now slowly approaching its long term down trendline and I think it has got a good shot at getting some sort of breakout going.

I believe earnings are coming out on August 11th.  Not sure if that is going to be the catalyst or not, it could be.  So far GSS has touched its long term down trendline 3 times previously, so this resistance line is definitely significant.

When you combine this price structure with my previous alert on the gold price, you have the makings of a high probability trade.

Read more

Gold Futures Gold ETFs and Gold Stocks Blockbuster Trade Alert

alert

BestOnlineTrades is issuing this blockbuster trade alert on the gold sector.  Whether it be Gold Futures, Gold ETFS (such as the GLD or DGP ETF), micro cap through large cap gold stocks, or even long dated call options, we believe the gold trade will be the most popular and productive trade for the next 9 to 12 months.

This is a very important alert and we feel that this alert may go down in history as being the most valuable and important alert we have ever issued. 

BestOnlineTrades has studied the gold market carefully since 2003.  We have seen and recognized the beginnings of this bull market at that time and feel that right now, perhaps even as soon as this week the gold trade will activate and turn into one of the biggest breakouts the world has ever seen.  It may not seem like a breakout at first, and it may disguise itself by transforming into a ‘slow motion’ breakout, but we believe it will still be seen in hindsight as being transformational.

While we do not talk too much about fundamentals here at BestOnlineTrades, we remain open to the possibility that inflationary trends will start to become more entrenched and severe during the next 9 to 12 months.  Part of the reason for this observation has to do with the fact that the US Dollar Index precisely aligned and topped with the April 21st, 2009 Marty Armstrong Cycle date precisely.  The Marty Armstrong Cycle is a very powerful 8.6 year global business cycle model that has proven itself to pick extremely important turning points in major markets worldwide.  The fact that the US Dollar has aligned itself to the model is an event in our opinion that is not to be taken lightly.

Read more
Gold Futures create a Double Inside Quarter

goldfutures20090729

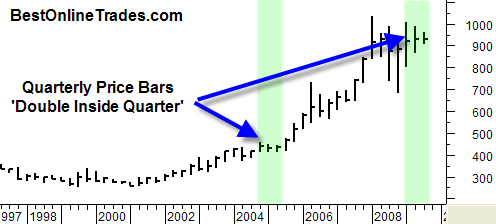
The chart you are looking at here is the quarterly price bar chart for the continuous gold contract.  I love long term charts like quarterlies because they forecast bull market moves and are definitely geared towards longer term forecasts.  This gold futures chart is no exception.

Something very significant has developed in the gold price on the quarterly chart.  For the first time since 2004 (that was a long time ago!) we see a double inside quarter developing.  A double inside quarter exists when the two most recent price bars each have lower highs and higher lows than the preceding price bar.  It is similar to a ‘coiled spring’ in that you have price compression.  These ‘double inside’ patterns do not really forecast price direction either up or down, so we could see a big move up and out of this pattern, or down and out of the pattern.

Read more

There is a Blockbuster Trade Developing in the Gold Market

gold20090722

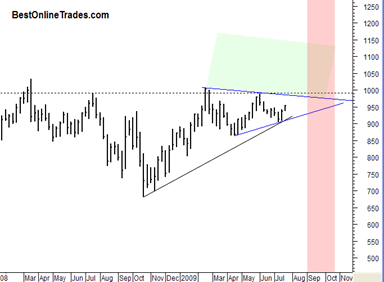
There is in my opinion a blockbuster trade developing in the gold market right now.  It is one of those slow motion type developments that usually catches people off guard.

This has the potential to be a very big trade in my opinion.

The chart to the left is a simple representation of what I am talking about. I will go into more detail on this in future posts.  You can click on the chart to the left to see it full size. The trade developing is a combination of a symmetrical triangle pattern in the gold price in addition to very bullish seasonals coming in September 2009.  The red shaded area represents the very bullish seasonal time frame for the gold price.  The green shaded area represents break out territory of the gold price from this several month congestion area also represented as a somewhat large symmetrical triangle pattern.

Read more