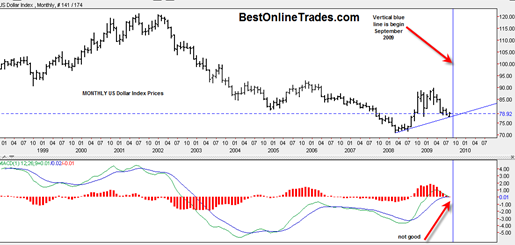
Monthly US Dollar Chart Indicating it May Break Down Severely in September

monthlyusdollarindex

I have some new information on the US Dollar index and wanted to bring it to your attention.  My obsession with the US Dollar Index continues… But why? Why am I so obsessed with the US Dollar Index.  I am because it is either going to help gold do a MEGA breakout or it could potentially hinder any breakout in gold or even cause a break down.

I just wrote a post on the negative seasonals that are kicking in for the US Dollar Index starting right now.  But I only just now discovered a new perspective on the US Dollar Index that is giving me a little extra dose of confidence that we could see the US Dollar break down severely in September and subsequently cause the gold price to spike to a new all time 30 + year high.

Read more

The Gold Market Chips are on the Table so Lets Roll

DX

The gold market chips are on the table and the US Dollar chips are on the table, now lets roll…

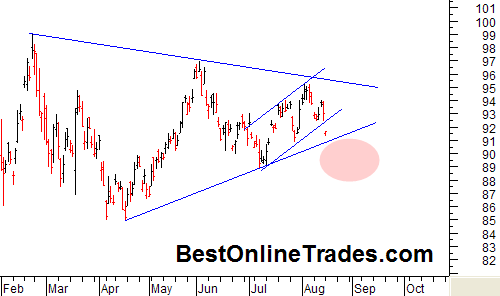
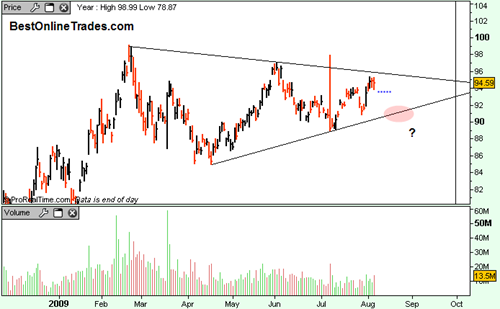
The gold price has now touched the top portion of the symmetrical triangle 3 times and the bottom portion 3 times.  One way or the other we will get a resolution.  Time wise I have calculated that the gold price cannot really extend much farther then end of September to make a decision because there is simply no room left inside the triangle.

The thoughts that go through my head when I look at the gold price triangle are something like, “Can this market really get an upside breakout?”, “What if the gold price extends too far into the apex?”, “This chart better start resolving itself SOON”.

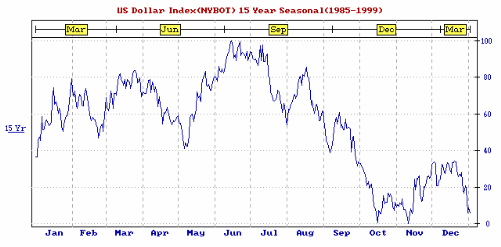
The chart above is the seasonal US Dollar chart between the years 1985 and 1999 courtesy the Moore Research Center.  What is interesting about this seasonal chart is that we can see that the US Dollar tends to have a lousy second half of the year statistically between years 1985 and 1999.  And if we look carefully at the chart we can see that the most devastating statistical downside for the US dollar starts at MID AUGUST (we are in mid August 2009 right now) and then continues almost relentlessly until mid October.

Read more

GLD ETF breaks down below rising channel

gld20090817

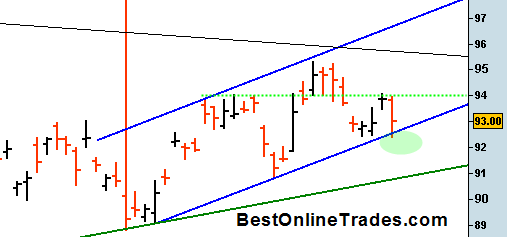
The GLD ETF has broken down below the short term up trending channel which was leading to a breakout out of this large symmetrical triangle pattern.  Gold clearly wants to test everyone’s patience and throw another curve ball at us.

The break down in the GLD today coincides with a breakdown in the broad market and a big move up in the US Dollar.  The GLD is still within the large symmetrical triangle and it is looking like it will come down to test the bottom of this symmetrical triangle.  I really would like to see it hold. 

If it does not hold then something else is going on in the gold market and I may have to rethink bullish possibilities.  I would like to see the GLD ETF hold above the 90 level and most certainly above the 89 level for me to still stay constructive on this market.

Read more

GLD ETF slightly Pierces Uptrend Channel

gld20090814

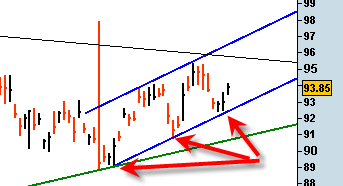
The GLD ETF slightly violated the blue uptrend channel I have been talking about this week.  The close was inside the channel however and the volume on today’s decline was really light.  I don’t like the fact that we slightly pierced the channel today but for now it is not the end of the world.

Within this up trending channel there is a slight tendency to an ascending triangle pattern with the green dotted line being the supply line and the bottom blue line being the demand line.  If I am correct in that assessment then it implies that there is not too much room left in the apex of this ascending triangle and either the pattern fails or we get a topside breakout out of the pattern which would have measurement implications within the critical upside breakout area.

Read more

The SPDR Gold Trust (ETF) Gets a Good Bounce Back Inside Channel

gld20090813 The SPDR Gold Trust (ETF) GLD was able to get a nice bounce going today off of blue trendline and channel support.
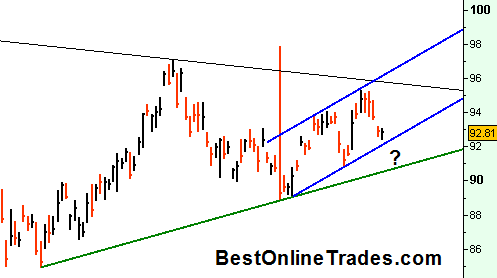
I am starting to get a few grey hairs watching this gold price trade inside the channel and also within the larger triangle.  I imagine that there are plenty of gold bugs out there who are also growing a little bit impatient with gold.  The GLD has been trading and consolidating going all the way back since March 2008.  In terms of trading time, that is a lot of time.

I am nervous about what the resolution will be with the SPDR Gold Trust (ETF) and I was especially nervous the last few days as this blue channel support was being tested and the US Dollar was perched for a breakout.

Read more

Gold Market versus US Dollar Battle Update

glduup

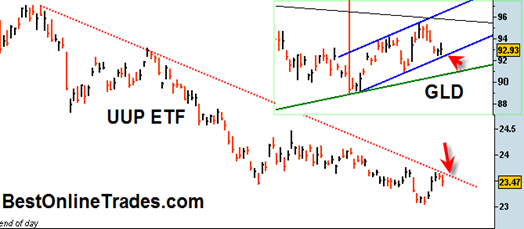
Today was a pretty wild day in the gold market.  Gold was up pretty good going into the FOMC meeting, then it sold off hard right on the FOMC decision and the US Dollar as represented by the the UUP ETF started rallying big time and was starting to create a very bullish looking hammer with price moving to the top of the bar.

By end of day, gold as represented by the GLD ETF was able to get some footing and settle for a mid range close.  The UUP also got a mid range close.  It is nice to see that the GLD ETF got a little bit of bounce going on the blue channel line I had mentioned several times before.  But it is still too close to call on whether the channel support holds for the GLD.  Perhaps the next two trading days will tell the tale.

I would absolutely love to see the GLD ETF hold this blue channel line and get a move going back UP again and towards the top portion of the channel.  That would be exciting because it could imply another possible (and maybe final ?) breakout attempt of the top portion of the symmetrical triangle.

Read more

The Gold Market Battle Continues

gld20090811

The GLD today barely did anything but is still inside this blue trending channel which I talked about previously being important for a ‘breakout by September 10th’ scenario.  The volume today was really light on the GLD and it looks to me like the success or failure of the retest of the bottom of the blue channel line could occur tomorrow.

If we break under the blue channel line then it is going to open the door to another retest of the bottom of the symmetrical triangle (the green line).  If that happens it will be critical to hold the bottom of that triangle for an eventual breakout later in September or the final quarter of this year.

I would like to see the US Dollar break down tomorrow and see gold jump right back topside to make another attack on the top portion of the triangle.  But what I wish for and what happens are two entirely different things.  The US Dollar still looks like it wants to pop to the upside as a resolution to its bullish divergence.  But maybe something out of tomorrows FOMC will change that outcome? 

Read more

Gold Needs to get Moving and Soon

gld20090810

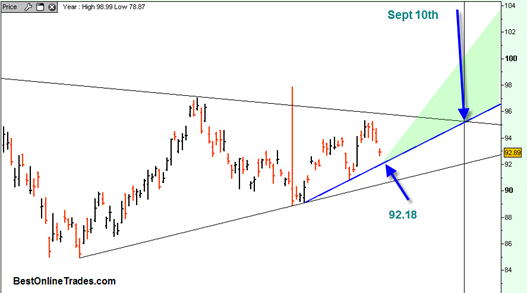
If the gold price is going to get a breakout going out of this large symmetrical triangle into the typically strong seasonal time period of mid-September, then it needs to hold above the blue trendline drawn above.  It needs to remain above this blue trendline for the next month or so if an accelerated breakout scenario is to take place.

It would be an ideal situation for a breakout out of this symmetrical triangle because going too much further into the apex of the triangle could possible weaken any potential breakout.

I have labeled minor support along that blue up trendline as 92.18 on the chart of the GLD ETF above.  I would expect at least a one day bounce after touching that line.  A break under it would invalidate the near term breakout scenario and open the door to a move back down to the bottom portion of the triangle.

Read more

GLD ETF Meandering inside a Triangle

gld20090807

You probably just read my previous post on the US Dollar index where I talked about how the dollar really needs to stay below that funny blue looking line to keep it in a near term bear trend. 

But now we are looking at the GLD ETF which is in a sideways triangle.  Triangles can be a real pain because volume gets really light as price compresses into the triangle.  I am starting to think that the GLD ETF is going to make another trip to the bottom boundary of this triangle near the red shaded circle on the chart.

Read more