The Gold Market Deserves Full Coverage

In the days and weeks ahead I may start to do more close coverage of both the gold price and the mining stock sector.  I may do this because of the chance that the gold price may soon unleash itself into a raging (bullish) monster and it could start to become more relevant and timely than any other sector in the market right now.

I have been doing a lot of coverage of the sp500 and the SPY ETF.   But I have to tell you honestly, where is the trend in that market ?  It seems like a wasteland of swing trading ranges and lack of real gusto in terms of direction.   The direction will eventually reveal itself but I want to cover the areas that I believe deserve the most attention and ahead of everyone else before they become ‘mainstream’ ideas.

Of course I will still need more confirmation about the possible moves in the gold and mining stock sector in the weeks and months ahead but I am sensing that something big may be close to happening in this sector and I want to be on top of it before the dog and pony show starts on the major business TV networks.
It could very well be that the gold market will become the ‘only game in town’ soon.  People have said that before but to be honest I have still up to this point not really noticed a mass public adoption of the gold story.

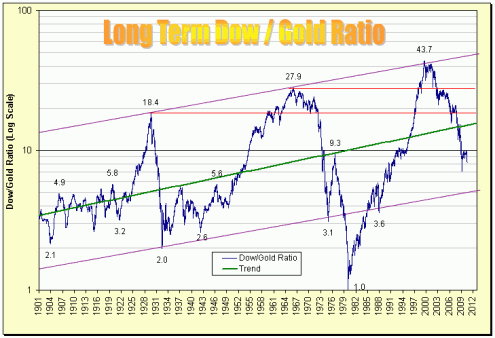
Read more

SPDR Gold Trust GLD ETF Close to a MACD Histogram Confirmed Buy Signal

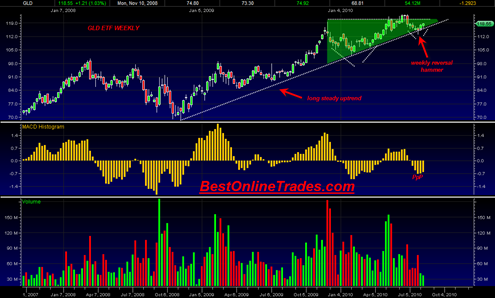
The SPDR Gold Trust (ETF) appears to be close to a weekly confirmed MACD histogram buy signal.  The GLD ETF needs to get a weekly close tomorrow above 118.42.  Currently it is trading at 118.56.

A confirmed weekly buy signal on the MACD histogram tomorrow would in our view be very significant as we are just 2 weeks away from the seasonally very powerful month of September for the gold market.

The weekly chart also shows a weekly reversal hammer of 2 weeks ago in which the trading low of that week tested the neckline of the previous head and shoulders bottoming formation.

The SPDR Gold Trust (ETF) also shows that it was able to crawl back above topside above the longer term up trendline.  This recent move appears to be creating a handle of yet another cup and handle formation which the gold market has been quite famous for time and time again.

gld20100812

One could also argue that the recent 8 to 9 month consolidation resembles that of an ascending triangle formation but is also a cup and handle pattern contained within it.

Read more

34 Year Gold Seasonal Chart

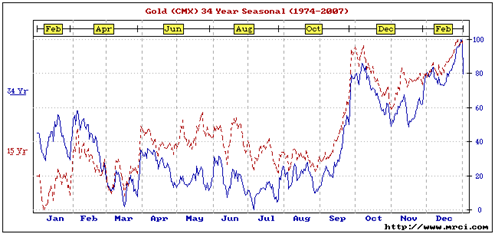
In case you have not seen it before, here again is the Gold price 34 year seasonal price chart.  A very timely chart right now as we are into the first week of August.  Sometimes it is easy to forget that the gold price can move very fast seemingly out of nowhere. September is really … Read more

Spot Gold on the Brink

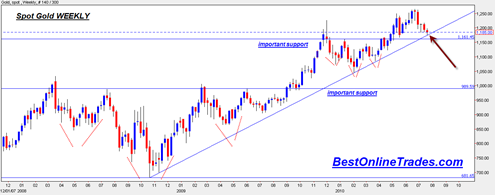
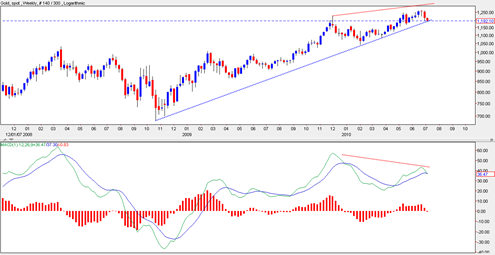
The weekly chart of the spot gold price shows that gold setting up for a very important test next week.  The test is to see whether or not the gold price can hold longer term uptrendline support on the weekly chart.

The uptrend shown in the first chart below is a 2 year uptrend line and has a good degree of significance.  If we break down through this trendline on the weekly chart next week then one has to question the current integrity of the gold bull market in my opinion.

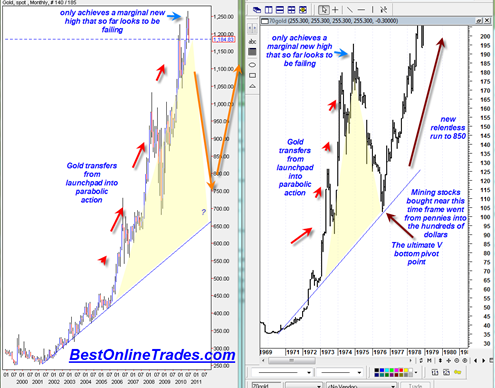
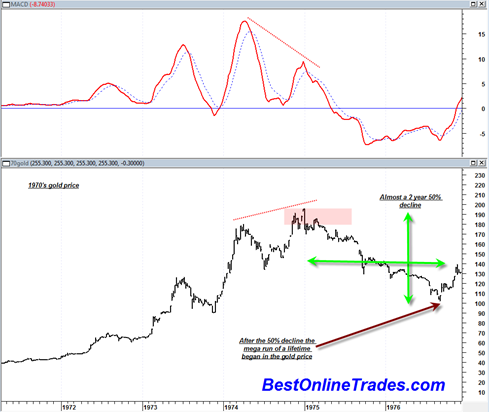
I did a couple other recent posts pointing out the weekly bearish divergence on the gold price chart and the similarity to the mid 1970s gold price topping formation.

If gold breaks down through the uptrendline next week then it would probably challenge the 1160 level which is an important level of support as it was the neckline level of the previous inverse head and shoulder bottom formation (see it drawn in on the first chart below).

If 1160 breaks then it could imply an eventual test of 990 level which once again is a very important level of support and again the neckline level of the previous massive inverse head and shoulder bottom formation.

Perhaps I am looking much too far ahead, but if we do get to 990 and then 990 also breaks it could imply a move down to 680 as a possible final bottom.  That would be roughly a 46% drop from the spot gold all time highs.

spotgold20100722

I think it is important to keep in mind that the gold price has been going up since 2001 or almost 10 years.  I am probably repeating this line of thought from a previous post, but even very strong bull market uptrends sometimes need a mid point correction as a pivot point for the eventual blow off down the road.

Read more

Gold Price Probably at a Major Major Top

I have been reviewing the gold price charts recently up to the monthly scale charts and I am seeing enough evidence to suggest that gold is about to head downtown for quite a while.

There is a class C (as defined by Alexander Elder) bearish divergence (between price and MACD) on the WEEKLY scale that looks confirmed to me as of today.  Of course the week is not finished yet, but I am sticking my neck out and will say this is a confirmed bearish divergence right now.   The only way the gold price can avoid this class C bearish weekly divergence is by blasting high by the end of this week well above the 1200 range.

Class C bearish divergences are known to be some of the strongest signals in technical analysis according to Alexander Elder.  And this is not a daily bearish divergence, it is a weekly one.  So that means it should have price trend implications for several months.  The divergence formed over an almost 1 year time frame which gives it a good amount of significance.

If you just look at the price one can also clearly see that it has printed a 2B sell signal on the weekly chart which is another bearish sign and can lead to a swift cascade down in price.

The chart below shows the two red dotted lines that define the divergence and also note the blue uptrend line on this log scale chart that shows price close to breaking down through an almost 2 year uptrend.

Read more

SPDR Gold Trust GLD ETF Looks Ready for a Big Move

The SPDR Gold Trust GLD ETF looks like it is just about ready for another big move.  Some time ago I did a post on why I thought it was prudent to be cautious on gold because there was at least the potential of a bearish weekly divergence developing.

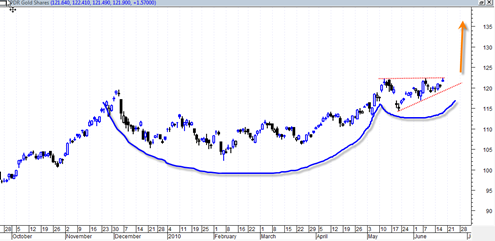
That bearish divergence has failed to play out.  And now the gold market finds itself in a position where the daily MACD is just about to turn bullish and the gold price is compressed into an ascending triangle.  In addition the weekly chart and the monthly chart still look bullish. 

So I have to tip my hat to the bulls here.  The monthly RSI is right into the powerzone and has plenty of room for upside expansion.

As long as the GLD maintains the current supporting ascending triangle structure I think you have to be open to huge upside moves.

If we see any closing prices below 120 in the week ahead then it would change the near term very bullish outlook and could completely reverse my opinion.  But for now I have to say the GLD has everything going for it to the upside and actually an entry right near these levels with a protective stop at 119 seems like an outstanding risk/reward.

Read more

I have a bad feeling that the Gold Price will get hit tomorrow

The gold price is in a very touchy situation right now based on the weekly chart and I have a bad feeling right now that gold will get clobbered tomorrow badly on the employment report.  The daily chart of the SPDR Gold Trust (ETF) shows a recent up move retracement on very light volume.

The monthly price swings are also showing me that we have a sell signal based on volume on the GLD.

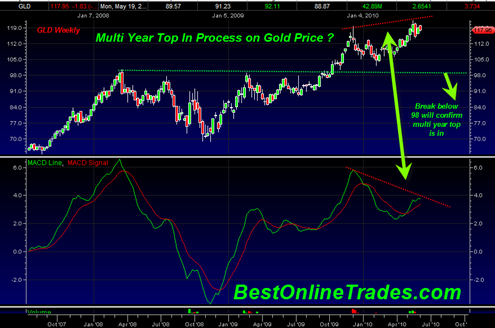
There is also a very ominous looking weekly price divergence that is developing which could turn into a confirmed sell signal in the weeks ahead.  I think people forget that gold can be extremely volatile to the down side.  It has had an superb run since the 2001 lows, but like any market nothing goes up in a straight line.  Markets need to build sideways cause after huge spikes upward as a foundation point for the next leg up.

If in the weeks ahead the SPDR Gold Trust (ETF) breaks below the 98 level then it is going to put a serious 1st nail in the coffin of gold for perhaps 2 to 3 years and we could see a 50% decline in the gold price from the all time highs.

This is exactly what happened in the mid 1970’s.  Gold went from 200 down to 100   but then after 100 it shot up to 850 for the final blow off run.   So if we break down to 650 then it could very well be the stopping point before another huge run to 5,500 gold price.  So the question is how many in the gold crowd want to sit through a 50% 2 year decline in the gold price ?  A 2 year 50% decline can be a very painful and emotional burden and cause one to doubt the entire premise of the bull market in gold. 

But a 50% decline would setup up massive cause and pivot for a blow off run to 5000 5 years from now.

Read more