SPY ETF Working into a Top the Next Several Days ?

I have gone back and forth with my bullishness and bearishness on the broad market recently.  I just think it is important to be prudently cautious at these levels. There is supposed to be an important astro aspect early next week that may stop this market dead in its tracks and case the long awaited … Read more

SLV Silver ETF does a Confirmed Breakout from Inverse Head and Shoulders

The SLV ETF did a confirmed breakout from the large inverse head and shoulders pattern that has been forming for quite a long time. This is significant because it is basically saying that silver should now be in a new longer term uptrend. The breakout was achieved with a confirmed sign of strength in price … Read more

GLD ETF breaks down below rising channel

gld20090817

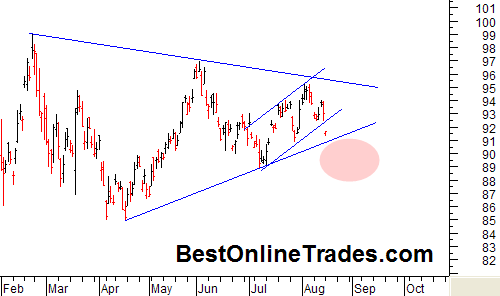
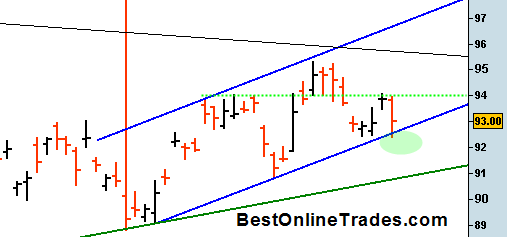
The GLD ETF has broken down below the short term up trending channel which was leading to a breakout out of this large symmetrical triangle pattern.  Gold clearly wants to test everyone’s patience and throw another curve ball at us.

The break down in the GLD today coincides with a breakdown in the broad market and a big move up in the US Dollar.  The GLD is still within the large symmetrical triangle and it is looking like it will come down to test the bottom of this symmetrical triangle.  I really would like to see it hold. 

If it does not hold then something else is going on in the gold market and I may have to rethink bullish possibilities.  I would like to see the GLD ETF hold above the 90 level and most certainly above the 89 level for me to still stay constructive on this market.

Read more

GLD ETF slightly Pierces Uptrend Channel

gld20090814

The GLD ETF slightly violated the blue uptrend channel I have been talking about this week.  The close was inside the channel however and the volume on today’s decline was really light.  I don’t like the fact that we slightly pierced the channel today but for now it is not the end of the world.

Within this up trending channel there is a slight tendency to an ascending triangle pattern with the green dotted line being the supply line and the bottom blue line being the demand line.  If I am correct in that assessment then it implies that there is not too much room left in the apex of this ascending triangle and either the pattern fails or we get a topside breakout out of the pattern which would have measurement implications within the critical upside breakout area.

Read more

Is a Sideways Correction the Worst the Bears will Give us?

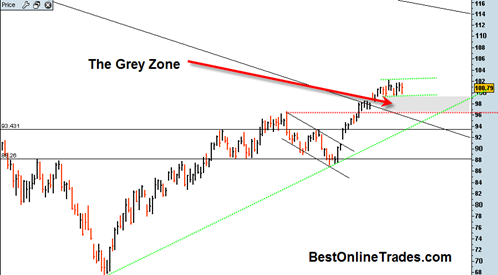
spy20090814  The SP500 was down on this Friday the second week of August.  But am I surprised? No. Not really.  This is about the time that traders head for the beaches. Plus it is starting to get way too hot and humid outside to be sitting in a room in front of the computer all day.  So a good bunch of them probably just sold to cash today and headed for the beach or the pool or for their favorite ice chilled beverage of choice.

All the bears could manage today was another down day within the smaller green channel I have drawn in the chart.  I am still open to the possibility of 95 on the SPY ETF as a normal corrective retracement and testing of the breakout area.  It would get us into the ‘grey zone’ so to speak and help correct off some excesses.

Read more

UNG Natural Gas ETF Cannot get the Job Done

ung20080813

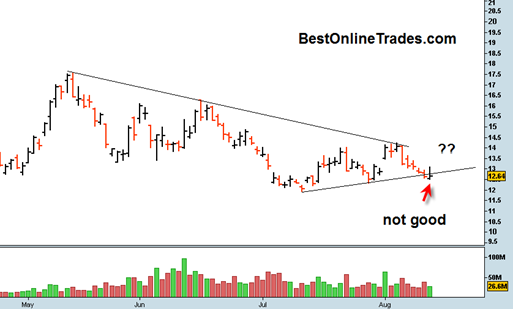
I talked about the UNG ETF several other times and at this point I am going to just have to put it in the freezer for while.  The trend has been relentlessly bearish.  I thought a couple of weeks ago that the UNG Natural Gas ETF would be able to get some sort of spike rally higher based on the monthly chart because there were some weekly divergences building and the monthly chart was showing at least some promise of a reversal in August.

But as of today the chart looks weak and horrible.  Today and yesterday we briefly broke under trendline support and may warn of an impending break below which could be really bearish.

Read more

Nasdaq QQQ Blasts Higher today on Robust Volume

qqqq20090812

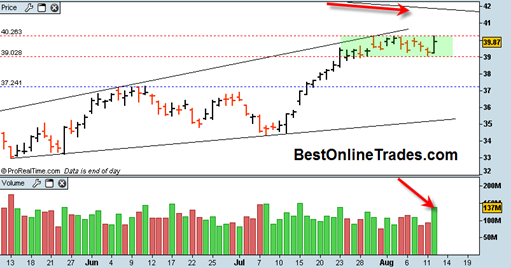
The move today in the QQQ was pretty impressive.  It was impressive in the sense that the bears should have been able to break under the green shaded rectangle and get the much awaited correction going, but the exact opposite ended up happening.  The upside volume was 137 million shares and is a solid way to get a bounce going inside that rectangle. 

This rectangle is depicting internal market strength once again to me and hinting at an eventual possible breakout above this rectangle to towards the 41.5 level which is right at the point of the long term bear market resistance line.  Perhaps we get a retracement the next could of days and then a breakout out of this rectangle next week sometime?

It is almost mind boggling that we are getting this strong price advance and this robust volume at this point in August.  It would seem that traders are in no mood to hit the beach this year.  They would rather be in front of their computer screens. Hmm.

Read more