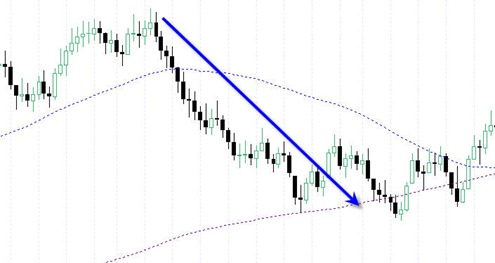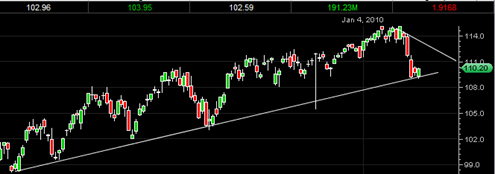
SPY ETF setting up for a Flag Breakout

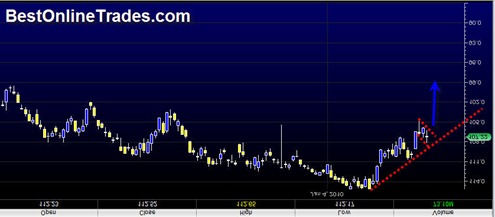
Believe it or not, the chart above is a chart of the SPY ETF.  But instead of showing you the chart the normal way, I flipped the chart upside down and then mirrored the chart.  So the price action you see at the right portion of the chart shows the SPY in a strong uptrend. … Read more

Financial Stocks hit One Out of the Ball Park

Shitibank Shirt

For months on end there has been lots of bashing and negativity on the financial stocks.  Uncertainty and fear and anger over the unjust billions lost and sloshing around in that sector has turned a lot of mainstream opinion quite negative on this sector.

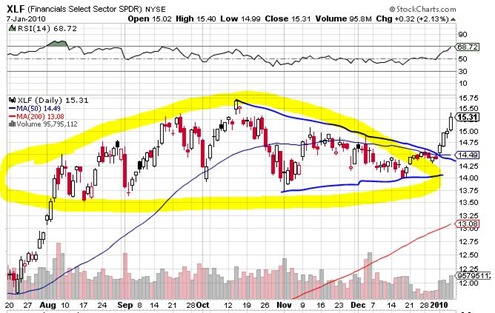
From many trader’s perspectives I believe this was also the case.  For every positive story I read or heard on the financials stocks it seems there were at least 4 that were negative in terms of fundamentals or technicals.  I must admit I also have had a bearish take on the large and somewhat lengthy broadening topping pattern in the XLF financials ETF. 

It was hard to get bullish on this large pattern because it seemed to be  not only a rounding topping pattern but also a very bearish broadening topping pattern.  I tried shorting the XLF a couple times towards the end of 2009 with very meager results.  I remember sitting in those trades all excited about a huge expected break down.  But then I also remember total frustration at how the XLF time and time again just would not break support or get enough selling power to cause some real trend breaking type moves.

Read more

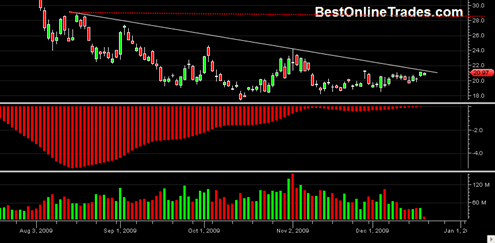
FAZ Triple Bear Financial ETF is Still Setting up for a Big Move

FAZ20091222

The rest of this week is pretty much a non event as far as the market goes.  Volume has dried up to almost nothing in recent days which of course is no surprise given the holiday week we have this week and the half day of trading on Thursday.

I still think this market is within a 1 week window of a significant top at these levels.  If the market is up very significantly the next two trading days and/or the last 4 trading days of the year next week, then I am probably wrong about this being a top.

However, if we are down tomorrow and either flat or down on Thursday, then we may be set up for a nasty plunge sometime next week or end of next week.  That is how all my charts are set up.

The Bollinger bands on the major indices are extremely tight right now which makes sense given the tight trading range we have been in for about a month.  Volatility is at record lows as well.  At some point the Bollinger bands are going to start expanding and create a new volatility trend.  It could be either up or down, but my take is that it will be down and possibly fast and furious down.

Read more

Direxion Daily Financial Bear 3X Shares Look Very Good To Me

FAZ20091218

The FAZ Triple Inverse Financial Bear ETF looks extremely attractive to me right now based on everything I am seeing in the market.  The UNG performed as expected and is now getting to be a tired trade already and I suspect it will pull back some before building higher down the road.

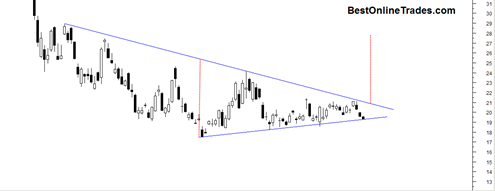
But now the FAZ has flashed all sorts of buy setups and looks very good to me going into next week and end of year and early January.  I think we could see FAZ blast higher into the high 20’s range during the next 1 month time frame.

As I indicated in a previous post, the WEEKLY MACD has now turned down on the SPY and the SP500 index.  That means that the market will have weekly bearish headwinds going into next week.

Read more

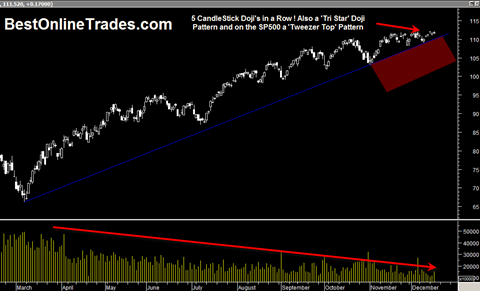
SPY ETF Shows some Possible Ominous Bearish CandleStick Patterns

SPY200910172009

There are only about 8 real trading days left until the end of the year if you exclude the days around Christmas.  So that means about 8 trading days to create the final YEARLY price bar close and then start the next one for 2010.

The market has powered up so fast and so persistently in 2009 that one would think people would take at least a few points of profit and capital gains.  For us to close the 2009 yearly price bar only a couple points from the yearly high seems improbable.  Just like on a daily price bar right before 4PM you see day traders exiting, I think we could see similar type price behavior going into end of this year.

In addition I should also tell you that I have noticed some OMINOUSLY bearish looking candlestick formations in recent days on the SPY ETF and DIA ETF and also the SP500.

Read more

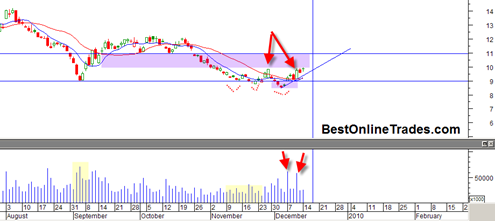
UNG Natural Gas ETF Still Has an Interesting Price Chart Setup

UNG20091214

I continue to be long the UNG natural gas ETF since I first mentioned going long at 9.38 on December 8th.  Despite all the negatives you will hear on stock message boards and elsewhere about how no one needs Natural Gas anymore, the chart is quite compelling to me.  There is so much negativity on this ETF right now that just based on that alone it is at least worth a look.

Did you know that if the Dow Jones Industrial Average was up the same percentage amount as the UNG ETF was on December 10th, 2009, the Dow would have been up about…

787 Big Dow Points in One Day!

So my point is that the market is always throwing you different pitches, each with a different risk reward.  Where the risk appears to be the highest it is often the least, and where the risk appears to be the lowest it is often the highest. 

Read more