SPDR Gold Trust (ETF) warming up for a big move

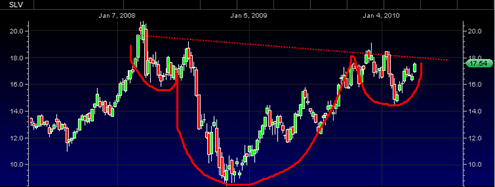
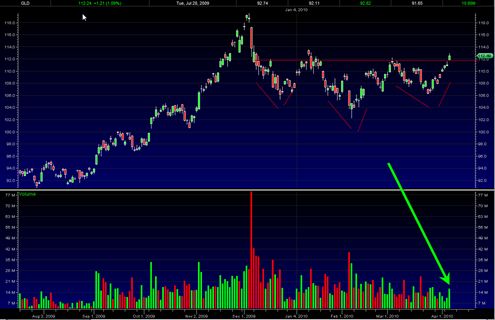
I suspect that a big move is coming in the gold price and the GLD ETF (SPDR Gold Trust).  Today gold behaved extremely well in the face of the first general stock market decline in over a month.

It could very well be that the gold price will begin to trade with relative strength to the stock market as the stock market is extremely overbought right now.  In fact I would not be surprised to see the stock market start to head south for the long awaited correction and then see the gold price zoom higher totally ignoring what the stock market does and even using a decline in paper assets as more fuel to the fire.

The daily and weekly charts on the gold price look outstanding and I continue to believe that right now…

Gold and Gold Shares are Much Better Risk Reward than the General Stock Market right now!

The reason for this is simple.  Gold has been in a corrective phase since early December 2009.  This is a long time by trading standards no matter what security or index we are talking about.  This consolidation time for gold has put it in a position to head higher regardless whether or not stocks keep going up or start a correction now.

The gold price has led the way in breaking out to new all time highs and the stock market has LAGGED the way trying to catch up to the gold price but so far not even coming close to achieving it.

Read more

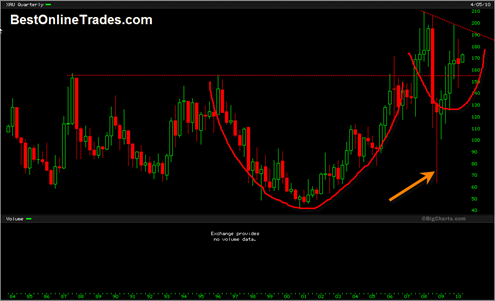
A few Observations on the XAU Mining Stock Index

The XAU Gold and Silver Mining stock index has a reputation for being extremely volatile and choppy.  It is a slow moving beast and is also represented by the GDX Market Vectors Gold Miners ETF. Mining stocks and mining stock indices remind me of biotech stocks because they both seem to trade very erratically with … Read more

Market Bullish Tendencies Keep Rolling on

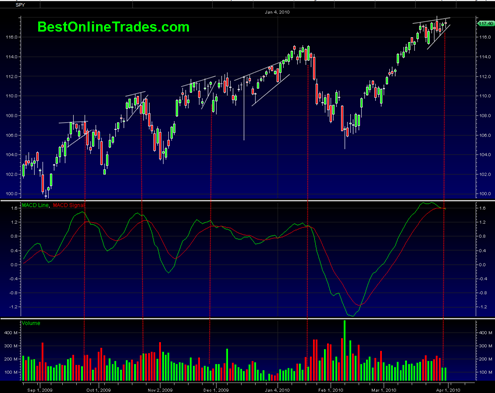
The market is zooming right into April and the previous monthly MARIBUZU (almost a maribuzu) candlestick is so far evolving into anther maribuzu candlestick for April.  The market is strong. There is no denying it.  The WEEKLY relative strength index is getting close to busting into the 70th percentile powerzone which is a rare but … Read more

Time for a Change in Trading Strategy Towards Gold and Precious Metals

I am a bit frustrated with the stock market indexes right now.  In fact to be honest with you I am sick of them.  There are still opportunities on the long side on plenty of individual stocks (Las Vegas Sands Corp is one of them), but in my opinion it is too late to jump into the long side of any indices, even if they do go to 1200 to 1250 on the SP500.

Where is the risk reward ?

The risk to reward ratio on the indices right now seems like it is close to 2 to 1.  Two ounces of risk for every ounce of reward.

Now as far as the short side of the market and the inverse ETFS such as the Direxion Daily Small Cp Bear 3X Shs (TZA) ETF, it would seem that this inverse ETF still offers some good risk reward to the upside.  But the problem is that today’s close in the indices was still more of the same.  Inching higher like slow water torture 1 point, 1 day at a time for the next 30 days.  That trading dynamic can go on for a long time and to be honest I don’t know when it will stop.

So that means that despite the apparent  good risk reward in the inverse bear ETFS, unless they start performing from the get-go next week, it will be more of the same as their inverse dribble down relationship mirrors the dribble up move of broad market indices.

Read more

The Stock Market Lions are Sleeping Today

AAAAAs_u3IkAAAAAAIDjiQToday was about as boring a day as I can remember in the stock market.  In fact it seems like it is Christmas 2010 already or the day before the new year.  You give me a dollar and I will give you a dollar back, and then we do that about a thousand more times.  That pretty much sums it up for today.

I attempted to go long LVS Las Vegas Sands Corp today but then got scared and jumped out within about 15 minutes.  I made that decision because of the volume non confirmation I mentioned in my previous post.  Today could have been the final low in Las Vegas Sands Corp before moving higher, but for now anyway I am going to stand aside.  I am just too nervous about the general market as a whole.  And honestly the ideal entry for LVS should have been way down near 16 and change.  That is where the MACD buy signal was generated and now the MACD is toppy and overbought.

So why didn’t I grab some LVS near 16 and change? Good question.  Probably because it was not jumping out at me at the time.  But that is always the tendency of the best buy setups, they are always quiet and not obvious at first.

I think I am scared money right now. I can’t help it.  I would rather not be too committed towards either side of the fence.  I would rather be right on the fence right now.

Read more

iShares Lehman 20+ Year Treas.Bond Looks Extremely Bearish on Monthly Chart

tlt20100325

The iShares Lehman 20+ Year Treas.Bond monthly price chart looks very bearish to me right now and seems to be telling us that higher interest rates are coming in the months/year ahead.

The iShares Lehman 20+ Year Treas.Bond is showing a very large descending triangle pattern on the monthly chart after being stuck in a messy trading range for the last 10 months.  The last two days down volume was extremely heavy and in the near term is a telling sign of a possible continuation move as we go into the second quarter time frame.

We all know that the broad market averages do not like higher rates so this chart if eventually confirmed paints a picture of eventual pressure on stock prices.

It also seems to be saying that the US dollar Index will extend its northward move in the weeks/month ahead.

It seems like the whole world already knows about the US of A debt problems and the degree to which we are over extended in terms of our current borrowing and our ability to borrow any more.  But up until now it just seems that no one has had to pay the price for those excesses.  It seems as if no penalty or real crisis has evolved into something tangible yet.

Read more

Went long the TZA Direxion Daily Small Cp Bear 3X Shs 7.50 April Call Options

Today’s reversal candle was pretty nasty looking and serious enough for me to jump into the TZA Direxion Daily Small Cp Bear 3X Shs 7.50 April Call Options.  I will probably go long the TZA directly or some other inverse bear ETFS tomorrow.

This looks like an important top, but it is way too early for me to be talking about it being ‘the top’.  It could just be a swing trading type of top, but it looks serious. 

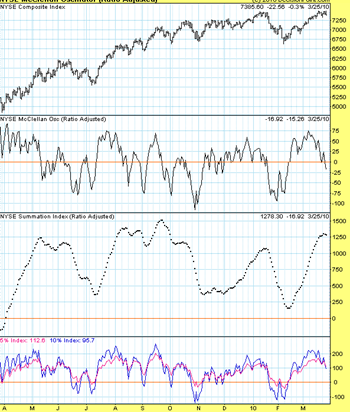
In addition the Mcclellan Oscillator looks very ominous as I see a double top in price of the New York Stock Exchange and an oscillator that looks ready for a steep decline.  Price usually follows the oscillator down.

mclellan20100325

It remains to be seen how well some of the stocks behave in the coming correction.  I just got done talking about how great LVS Las Vegas Sands looks, but if the market as a whole falls apart, LVS is going to have to the 20 level, otherwise a more complex correction could ensue and it would have created a false breakout.

Its funny how yesterday I was talking about not shorting this market until the 50 day crosses negatively down through the 200 day moving average… but then only a day later I am trying to be a hero calling a market top.  I guess it is just too tempting to try to nail an exact top because most of the ‘juice’ of the decline seems to happen in the first 20th percentile.

Read more

What I learned looking at 100 ETF Charts Yesterday

This is just a quick post.  But I wanted to relay to you what I noticed looking at 100 ETF charts across many different sectors yesterday. Put simply, my take is that many of them look surprisingly constructive.  More specifically I am noticing quite a few clear head and shoulder bottoming formations.  If they engage … Read more