The Problem with Rising Wedges

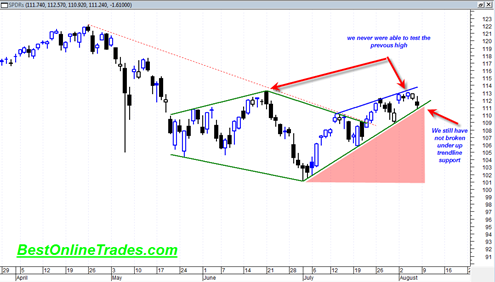
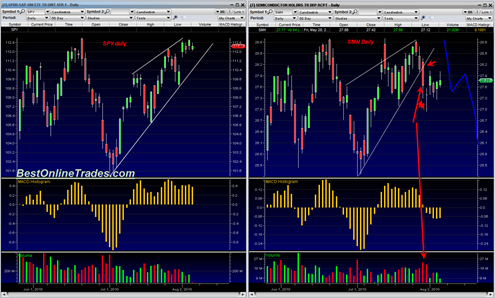
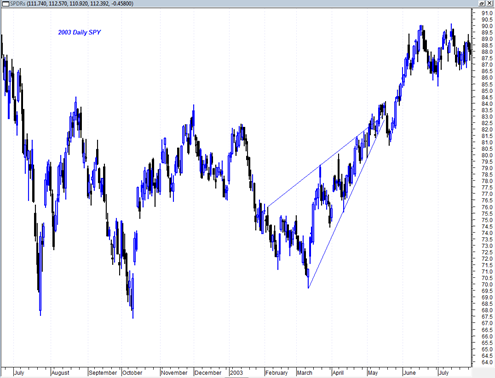
One of the problems with rising wedges is that they can sometimes fail just like any other technical analysis pattern.  I have been thinking about the rising wedge I just discussed in the post previous to this one and it occurred to me that rising wedges are probably more reliable after they form from a … Read more

Here we Go Again

This market is bouncing up and down so much lately that I am starting wonder what is the longest time period that I will maintain a consistent market stance, either bullish or bearish.  I have been talking bullish lately on the intermediate term time frames, but looking at the near term daily chart today has … Read more

SPDR S&P 500 ETF Drifts Lower Today on Meager Volume

The SPDR S&P 500 ETF today broke down today on 35% greater volume than yesterday although still relatively lower volume as compared to other break downs in recent months.

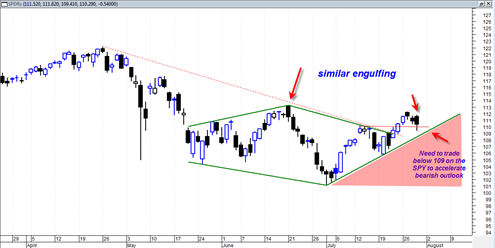
Today the SPY candle engulfed yesterday’s doji candlestick on 35% greater volume.  On the Dow Diamonds DIA SPDR Dow Jones Industrial Average ETF today we engulfed yesterday’s near perfect doji on 55% greater volume.

This bearish engulfing setup is somewhat similar to the one that occurred on 6/21/2010 except that today’s engulfing has a slightly more bearish volume characteristic.

Despite these short term signals the fact still remains right now that the SPDR S&P 500 ETF is still trading both above the red dotted down trend line that has defined the bear phase and also above the near term green up trendline since July 1, 2010.

spy20100729

These two facts make it hard to be super bearish right now despite the near term signals of a possible turn down in the market right here.  It looks like the GDP report tomorrow is going to swing this market in a decisive direction.

I mentioned in yesterday’s post that the 1100 level on the sp500 was minor support and ideally for the bearish case would close near there or below it by end of this week.  That type of close would set up a nice weekly hammer reversal candlestick and give a good shot at next week being hard down.  Breaking below the 1100 level enough on the sp500 could help to accelerate selling a bit and also create a 2B sell signal.  But again, unless we start trading seriously below the 109 level on the SPDR S&P 500 ETF then I have to conclude that the bulls still have some steam left.

Read more

Semiconductor HOLDRs SMH ETF Breaks Down From Trading Range

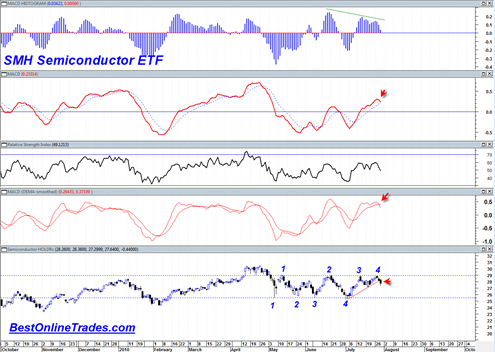
The Semiconductor HOLDRs ETF or the SMH today broke down with heavy volume through the short term uptrend that has been defined since July 1st, 2010.  It looks like a valid break of this short term up trendline and it was done so with volume conviction.  Some may say that the Semiconductor HOLDRs are a … Read more

Gold Price Probably at a Major Major Top

I have been reviewing the gold price charts recently up to the monthly scale charts and I am seeing enough evidence to suggest that gold is about to head downtown for quite a while.

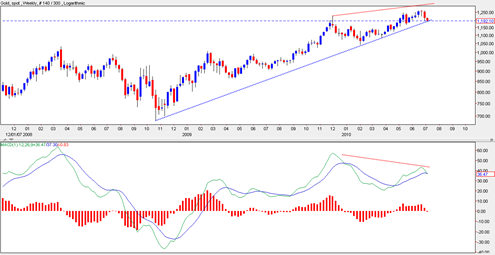
There is a class C (as defined by Alexander Elder) bearish divergence (between price and MACD) on the WEEKLY scale that looks confirmed to me as of today.  Of course the week is not finished yet, but I am sticking my neck out and will say this is a confirmed bearish divergence right now.   The only way the gold price can avoid this class C bearish weekly divergence is by blasting high by the end of this week well above the 1200 range.

Class C bearish divergences are known to be some of the strongest signals in technical analysis according to Alexander Elder.  And this is not a daily bearish divergence, it is a weekly one.  So that means it should have price trend implications for several months.  The divergence formed over an almost 1 year time frame which gives it a good amount of significance.

If you just look at the price one can also clearly see that it has printed a 2B sell signal on the weekly chart which is another bearish sign and can lead to a swift cascade down in price.

The chart below shows the two red dotted lines that define the divergence and also note the blue uptrend line on this log scale chart that shows price close to breaking down through an almost 2 year uptrend.

Read more

SPDR Gold Trust GLD ETF Looks Ready for a Big Move

The SPDR Gold Trust GLD ETF looks like it is just about ready for another big move.  Some time ago I did a post on why I thought it was prudent to be cautious on gold because there was at least the potential of a bearish weekly divergence developing.

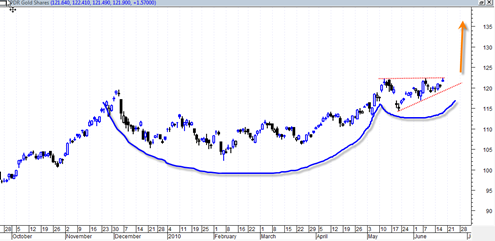
That bearish divergence has failed to play out.  And now the gold market finds itself in a position where the daily MACD is just about to turn bullish and the gold price is compressed into an ascending triangle.  In addition the weekly chart and the monthly chart still look bullish. 

So I have to tip my hat to the bulls here.  The monthly RSI is right into the powerzone and has plenty of room for upside expansion.

As long as the GLD maintains the current supporting ascending triangle structure I think you have to be open to huge upside moves.

If we see any closing prices below 120 in the week ahead then it would change the near term very bullish outlook and could completely reverse my opinion.  But for now I have to say the GLD has everything going for it to the upside and actually an entry right near these levels with a protective stop at 119 seems like an outstanding risk/reward.

Read more

A lot can happen in 8 Trading Days

My impression of today’s trading action is more of the same.  We are rallying on fumes (lighter and lighter volume) and it is an urgent warning to me that the market can retrace the rally that began on June 8, 2010 very quickly.  I still doubt that the next leg of the decline will start this week, but I suppose one could say that the heavy volume of options expiration this Friday could lead to unpredictable price action.  My take is that we somehow manage to stay afloat the next two trading days and maybe even blast up in one last ‘hurrah’ to close this week strongly higher.  But then next week ought to start down very hard and be relentless if my accelerated bear scenario is to stay in force.

A lot of price action (or price destruction) can take place in just 8 trading days leading up to the June 28th target date.  It seems too convenient that so many have forgotten the 1000 point 1 hour plunge that occurred in May.  I guess I cannot blame anyone as I cannot remember what I had for dinner last Friday either.  But my point is that this market can once again surprise with a speed that is unthinkable to even the most bearish of bears. 

If the June 17 to 25th, 2010 astro aspects are to have any real credibility then this market should start to show us something dramatic sometime next week and into the 28th. 

Read more

The Tape action was VERY UGLY today

This may be the most significant post I have done in a long time here at BestOnlineTrades.  I can smell a big drop coming, I can taste it, see it and feel it in my bones.  This is how the trading dynamic is setup up right now.  Let’s not forget how the first flash crash on May 6, 2010 started.  If you were looking at it real time you could see that it started as a simple calm looking DOJI candlestick but then transformed into a monster in minutes.

This may be what transpires over the next few days.  CALM teasing action to tempt the bottom pickers and the technicians into going long because the market is ‘oversold’, but then the bottom falls out seemingly out of nowhere.

Today’s tape action in the market may have provided the final nail in the coffin of evidence that we are about to plunge badly again, possibly in crash type fashion or just continued waterfall fashion with huge swings in both directions but ultimately a lot lower.

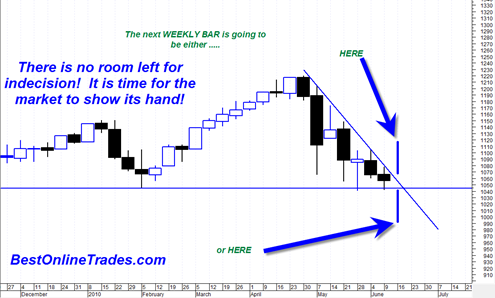
Make no mistake about it, I am extremely bearish on the market right now and today’s tape helped to remove any lingering doubts I may have had.  I see the market at a juncture right now where it must blast higher by several hundred Dow points, otherwise it will totally collapse.  That is how well defined it looks to me right now.  It is either or, and nothing in between.  If I am wrong here then I will be wrong very badly and we will see this market shoot higher very fast and very wide.  If I am wrong, then it may have to do with volume, because the volume was quite light today and makes downside follow through look suspicious.  However the low volume is consistent with the symmetrical triangle pattern and descending triangle patterns I have alluded to before.  So you can see a surge in volume come out of nowhere from these patterns.

Read more