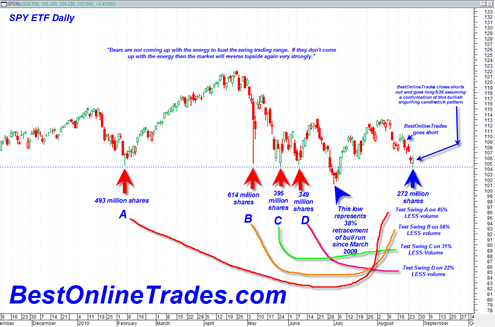
We are once again at a crucial juncture in the market and possibly a very significant turning point.
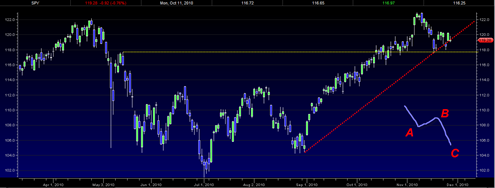
The SPDR S&P 500 ETF SPY today did yet another reversal and showed that the market is lacking enough energy to bust through the very critical lows of the large swing trading range since April 2010.
Today was a very very important day in terms of what the SPDR S&P 500 ETF told us. Today the SPY tested several very important key swing trading lows going all the way back to March of 2010. In each instance the lows were tested on substantially lighter volume which is a bullish reversal sign for the market once again.
The ultra bearish scenario may be completely dead as of today and I would say at this point to be extremely careful about being heavily short this market going into September 2010.
We closed out our short trade today on the SPY ETF and intend to go long in the morning with the following two conditions:
- We need a bullish confirmation of the recent two day bullish engulfing candlestick pattern. This means we need a close above 106.39 in the SPY.
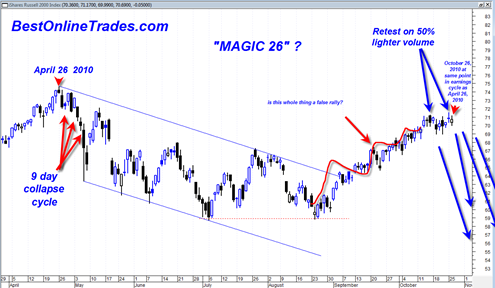
- Secondly, we need a bullish close above 605.71 on the Russell 2000 as a confirmation of a MACD Histogram buy signal. The Russell can tend to lead the market on both the bearish side and the bullish side of the market. Right now it seems to be leading and showing a leading bullish possible buy signal on the Histogram
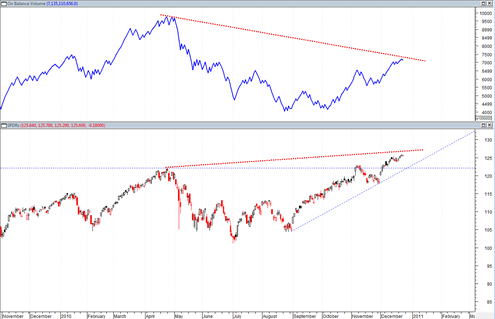
Probably most traders to not pay that much attention to trading volume. But if you think about it, volume can potentially be the most important clue the market can give us because the volume is essentially the energy that moves markets. It is the real money, the power that either has the force, or not.

