UNG Natural Gas ETF Reverses down hard

UNG2

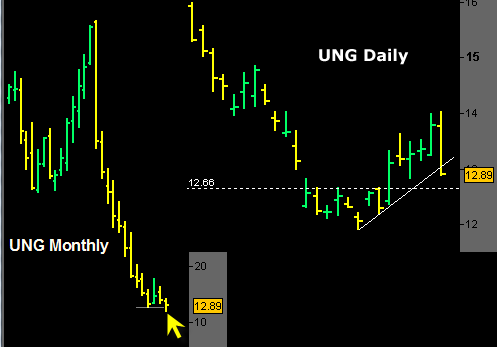
Ok well I am a bit disappointed in the way UNG played out. UNG stopped out today right at the close at 12.90 for a loss of 7.06%.  I suppose it is better to be stopped out right at the close of the day than to sit on something like UNG overnight.  This was a violent in your face reversal. Wow.  The chart above shows a clear birds eye view of what is going on with UNG.

The left side of the chart is monthly price bars.  You do not have to know much about technical analysis to know that this chart depicts a crashing price and severe price weakness. But the interesting part is the most recent monthly price bar that has a little yellow arrow pointing at it.

Read more

There is a Blockbuster Trade Developing in the Gold Market

gold20090722

There is in my opinion a blockbuster trade developing in the gold market right now.  It is one of those slow motion type developments that usually catches people off guard.

This has the potential to be a very big trade in my opinion.

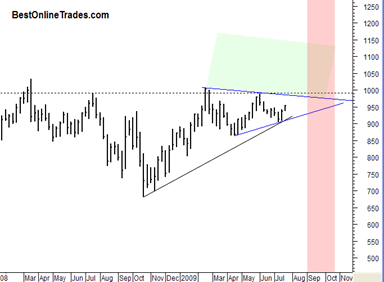
The chart to the left is a simple representation of what I am talking about. I will go into more detail on this in future posts.  You can click on the chart to the left to see it full size. The trade developing is a combination of a symmetrical triangle pattern in the gold price in addition to very bullish seasonals coming in September 2009.  The red shaded area represents the very bullish seasonal time frame for the gold price.  The green shaded area represents break out territory of the gold price from this several month congestion area also represented as a somewhat large symmetrical triangle pattern.

Read more

Time to RADAR UNG possible BUSTED Pattern Setup

This is an important heads up.

I mentioned the UNG Natural Gas ETF before as having a possible busted pattern setup (See the related posts section at the bottom of this article).  A busted pattern setup is when you see a stock or index have a breakout out of a pattern (for example a symmetrical triangle) in the intended normal direction of the pattern.  But then instead of a continued follow through, the price reverses back inside the pattern for a complete reversal.

By doing so the stock or index is giving the exact opposite signal. UNG is up 4% right now off the bottom.

ung20090722

Based on the chart above a move back inside the range of the triangle slightly north of the 15 area could activate the busted pattern bullish signal here.  There is absolutely no question that natural gas futures and the UNG have been in an extremely bearish trend since July of 2008.  So here we are at the bear market lows.  These types of setups off of major bear market lows can be some of the best setups out there because the first moves off of a bear market are usually the most rewarding.

Read more