SPY Bottomed Today

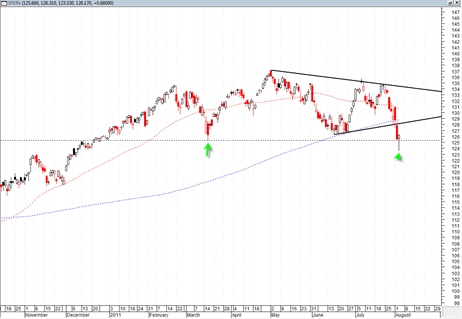
Today the SPY ETF Bottomed with a bullish spring formation in relation to the 3/16/2011 price swing low.  It was a bullish spring and rejection of that 3/16 low and volume shrunk by about 21%. 

So it is clear to me that we have bottomed in the short term and are now set to work higher in some type of counter trend rally higher.  This may end up being a low volume rally higher relative to the recent heavy volume decline and would set up a possible ideal re shorting opportunity in mid to late August 2011.

It is quite clear to me that the next big decisive move in the market will occur in the late August to early September 2011 time frame.

Counter trend rallies can sometimes extend a lot higher than at first thought.  I am thinking the SPY could get to the 130 to 131 range with an outside possibility of 132.5 as the most optimistic scenario.  The weakest bounce scenario would be about 128.5.

Read more

SLV ETF Continues to Power Higher along with Gold

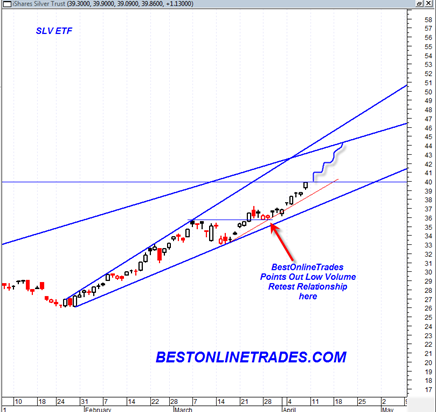
Both silver and gold continue to blast higher.  I think it is an important point to observe that gold and silver are pushing major new highs while the stock market seems to be drifting a bit.  For the first time in a long time I am maybe starting to wonder if we will see them decouple here.  In other words, see gold and silver start to feed off of paper equity market weakness.

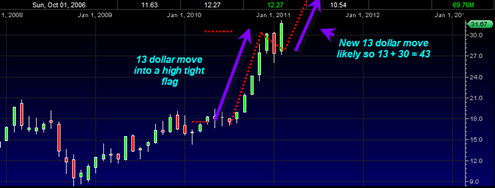
I wrote about the SLV trading in an expanding wedge formation and a low volume retest situation near the 36 range.  This has since led to a huge upside move.  Initially I talked about how SLV could hit the 40 to 42 range.  It could be that there is room up to the 45 range now.  The SLV is currently trading very strong in the RSI power zone and I suspect will continue to do so for a bit longer.

The metals really are the real bull market and this fact is likely to remain true for many years.

slv20110408

Read more

Mini Bear May be Over in IWM by Tomorrow March 25 2011

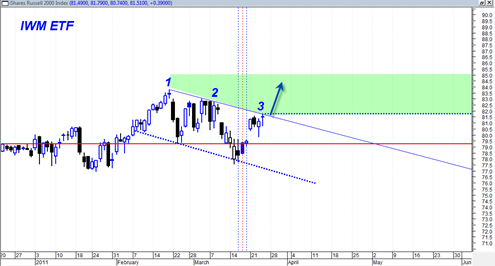
The mini bear we have seen in the market indices may be officially over by tomorrow near the open.  The IWM continues to trade right up to the recent down trend line that has defined this mini bear and is likely to bust above it tomorrow on the GDP report or even gap up above this resistance.  I pointed out in a previous post that the market would likely move into a stance where the GDP becomes the ‘decider’.  This appears to be the case now.  Also, the inverse head and shoulders on the sp500 appears to be filling out in correct formation as well.

If the GDP tomorrow is a horrible number then everything I just wrote in the previous paragraph is likely to be incorrect.  But near term momentum and even the after hours action today seems to suggest otherwise.

If the IWM and the other market indices get a break north tomorrow and then continue to drift higher into end of March, they will have once again been able to evade the potentially very bearish quarterly shooting star candlestick.

If that occurs, it would once again speak to the almost astonishing (or manipulated by easy money?) ability of the market to evade bearish signals and turn them into bullish continuation moves.

Read more

TZA TYP Look Like good Longs from here

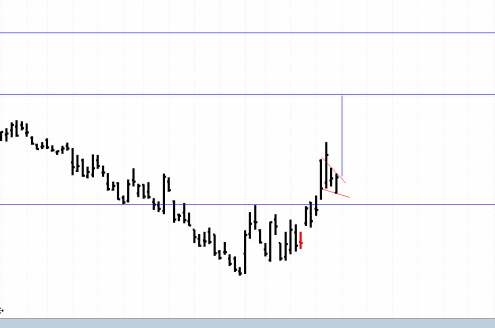
The inverse market index ETFS seem attractive now from current levels.  They have made an initial move higher 2 weeks ago and encouraged bears readily, but since then have bled lower again discouraging bears once again. However my sense now is that they are ready for another leg higher, possibly a significant move higher. The … Read more

XLF Financial Select Sector SPDR ETF at Previous April 2010 Highs

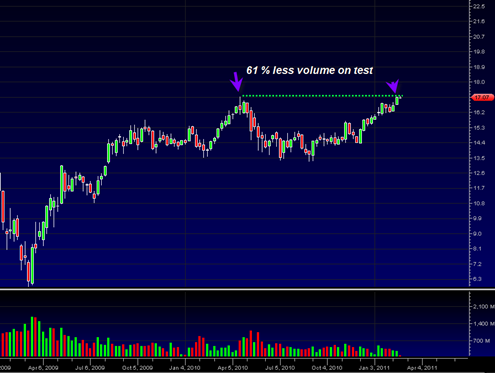
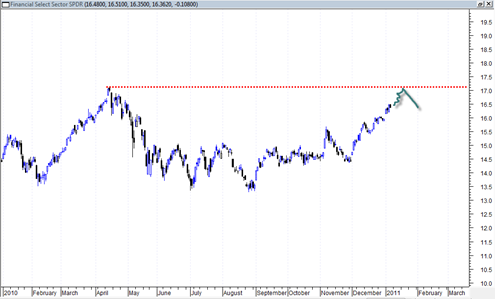
The XLF Financial Select Sector SPDR (ETF) weekly candlestick price chart shows no major bearish candlestick pattern, however the volume picture does not inspire very much confidence. The XLF is only just now revisiting its April 2010 high level after most other indices have exceeded it by an already large margin.  The advancing volume on … Read more

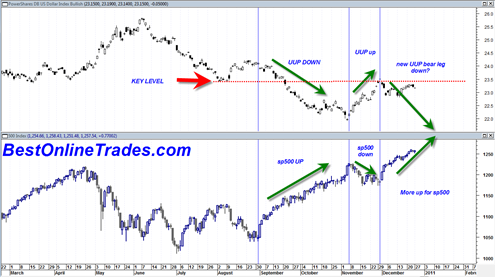
UUP US Dollar Index ETF Struggling near Head and Shoulders Neckline

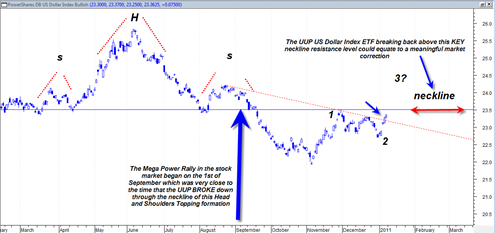
The UUP ETF is currently in somewhat of an interesting juncture.  The UUP US Dollar Index ETF has recently made a second attempt to break back up and through the neckline resistance level that defines a somewhat large head and shoulders topping pattern. This neckline level of 23.5 on the UUP is key resistance.  We … Read more