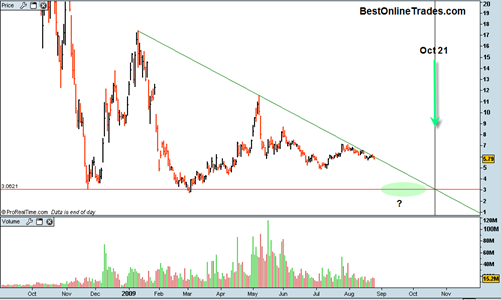
DRYS DryShips May be Headed for a Triple Bottom

drys20090825

DRYS DryShips over the past year has had some really huge swings and enormous daily volumes.  It rallied from a price of 3 to 16 in the past and then made a double bottom and rallied from 3 to 11.  Clearly  DRYS is capable of making some big moves on the upside and downside.

The current structure of the chart suggests to me that DRYS is still not done with its bear market yet despite the huge intermittent rallies.  It has a strong down trending force defined by the green down trendline and so far has obeyed that downward force.  Price has not been able to break above this line. 

So we still have a generally bearish trend in DRYS.

Read more

Edge Petroleum Corp EPEX Trying to Breakout North from Rectangle

epex20090821

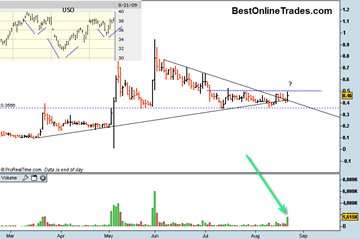
EPEX is trying to get some kind of a breakout move going but so far has been unable to get any kind of confirmation.

On Friday August 21st, it did manage to get another upward advance within the rectangle (defined by the blue horizontal and blue dotted horizontal) and also get a close above the down trend resistance line.  The volume also got a nice surge going today and may be an early sign that EPEX is close to getting above the .50 level.

It needs to get above and hold above .50 for me to start thinking a new uptrend has started.  So far still a no go, but I will take today’s action as a possible early clue.

Also note on the EPEX oil stock chart (click on it for full size) above the top left corner of the chart where I show the USO oil ETF.  It is possible that the USO oil ETF is close to completing a head and shoulders bottom formation.  I would think a northward breakout from that formation would definitely help the cause of EPEX finding a way to get a new uptrend going.

Read more

Quick Follow up on US Steel X

US Steel was up almost 9% today after my mention of it this past weekend.  I talked about how it appears to have a large head and shoulders bottoming formation.  Today’s action makes it look like the breakout from this pattern is in force.

The volume was very robust today especially for the first Monday in August.  This large head and shoulders bottoming formation has some rough targets. 

I calculate about 20 points between the low of the head portion of the pattern and the neckline of the pattern.  So the minimum measurement rule here suggests that US Steel could get to about 60.  Assuming this is the real breakout this week, then one thing to watch for is the retracement back to the neckline.  That may serve as a second opportunity to ride this new uptrend.

The size of this pattern is significant in that it is almost 1 full year long.  That is a lot of cause for a sustained move.  Head and shoulders bottoming patterns tend to be quite reliable in my experience.  They are not perfect patterns, but they do tend to give very reliable signals.

It should come as no surprises that US Steel got this move going in light of the fact that the US Dollar Index has broken down again in the most recent two days.  I talked about the US Dollar Index several other times and have said repeatedly that it is at a crucial juncture and at critical support.  Now it has elected to break that critical support.

Read more

US Steel X Almost done creating Inverse Head and Shoulders Pattern

It really is quite amazing. I feel like a kid in a candy store.  There are so many long side setups now that it is hard not to find one out there.  It is a result of the strong bullish persistence in the broad market as it rebounds out of the depths of its bear … Read more