The Crude Oil USO ETF trade did not work out

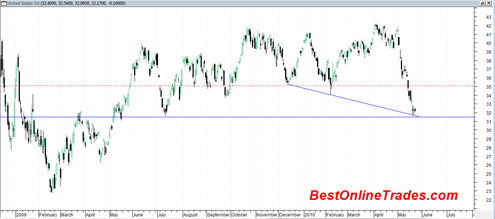
I was stopped out of the USO United States Oil Fund LP long trade I mentioned yesterday.  I think Murphy’s low applies here, what can go wrong will go wrong especially when it comes to picking spike bottoms. Crude Oil has moved into an even deeper oversold region and it could still be forming an … Read more

I just went long the United States Oil Fund LP ETF USO

Going long the United States Oil Fund LP (ETF) USO or the ProShares Trust ProShares Ultra DJ-UBS Crude Oil UCO ETF may be one of the most attractive trades I have seen in a long time.  It looks like it is an outstanding contrary type trade. I already mentioned that I am expecting a bounce … Read more

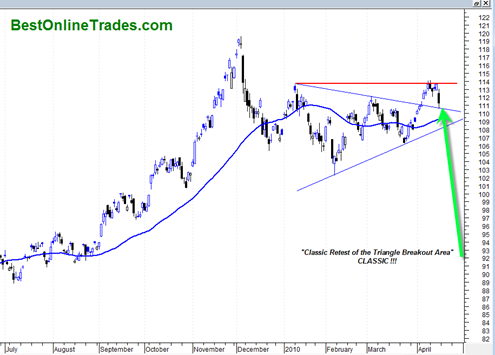
The SPDR Gold Trust GLD ETF should have been up 100 dollars today

One would think that with the major headliner news today regarding Goldman Sachs and the SEC you would see the gold price spike 100 dollars higher?

But no, the SPDR Gold Trust is singing its own tune and trading with a one track mind typical of gold.  2 steps forward, 1 step back.  Repeat. Rinse. Cycle Again.

But here at BestOnlinetrades we could care less what this headliner news is.  Trading off of news most of the time is a bad idea.  Sometimes there are exceptions to this rule, but what I have found is that most of the time one is better served to just trust the charts and the indicators (and the tape action!) as best you can because they are not in the habit of lying.

Read more

Natural Gas May be Bottoming Sooner than Originally Thought

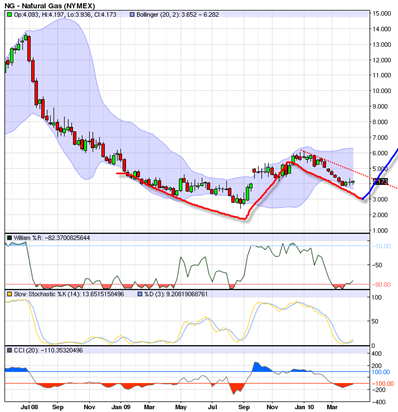
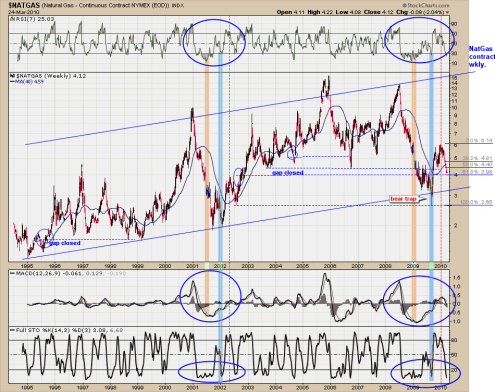
I am still watching the Natural Gas Contract fairly closely.  I thought originally that Natural Gas Futures would trade down near the 3 level as a final bear market low.  But there are a few elements in the current chart that have me at least considering otherwise at this point.

The the weekly chart of Natural Gas is used along with the Bollinger bands it paints a possible picture of a large W bottom forming with the Bollinger bands serving as support.

I recently just read over John Bollinger’s book on Bollinger Bands and he indicates through his book the identification of W bottoms along with the Bollinger Bands as confirmation.

He indicates that one might at first see price move out side of the Bollinger bands to create the first portion of the W bottom, then some type of rally can occur and then a retest of the Bollinger Band that does not break through the second time.  the second retest is also typically right portion of the W pattern before the new uptrend emerges.

Read more

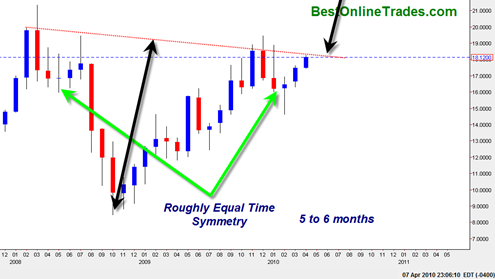
Silver Futures Looking Extremely Bullish next 6 to 12 months

If I am starting to sound somewhat repetitive, I am doing it on purpose.  Here at Best Online Trades I like to try to focus on the best risk reward scenarios at any given time.  Sometimes they are short term scenarios, other times longer term scenarios.

What has me very keen and interested right now is the precious metals sector.  And now even more so, the silver sector.  One of the most under rated and under covered sectors worldwide, the silver sector (which includes the silver price itself and the silver mining stocks) may be about to come more alive than any other sector in the market place.

The issue is though which is the best area of silver to participate in assuming a new strong bull leg is coming ?  My own personal take is that the AGQ ProShares Ultra Silver ETF is probably the best way to play the likely coming move in silver.  The AGQ is leveraged twice positively towards the silver price.  So if the silver price manages to make a 100% run in the next 1 to 1.5 years, then AGQ should perform close to 200%.

Now tell me where else in the next 12 to 18 months can you expect a 200% return? In the stock market ?  Bond Market ?  Real Estate?  Probably no, no and no again.

Individual silver mining stocks should get a good run going as well.  But since I have been watching the precious metals mining stocks since 2003 I can say that in general I have been usually disappointed in many or even most individual mining stocks performance relative to the metal itself or even ETFS.  There are just too many uncontrollable variables with the individual miners.  Why take all that extra risk when you have leveraged ETFs? I suppose it comes down to a question of greed since in some cases you will find individual mining stocks (juniors) go up by factors of 2, 5 or 10 of most other instruments.

Read more

Going Long the ProShares Ultra Silver ETF Today

Today I went long the ProShares Ultra Silver ETF (AGQ) which is leverage 2x the amount of silver.  If silver moves up 1% then AGQ attempts to move up 2%.  I need to put my money where my mouth is.  In a previous post I talked about how previous metals seem to have a better risk reward than the broad markets right now.

I went long the ProShares Ultra Silver ETF because I want to be early in what I see as a potential big move coming for the precious metals.  Silver has been the ‘slow dog’ in the bull run and to be honest has been severely lagging the move in the gold price so far. 

Having said that, there are two separate takes to explain this. 

One take is that because silver has been lagging the gold price so badly it means that the entire precious metals run is in doubt because silver is not confirming the move in the gold price so far.  This would be known as ‘non confirmation’ similar to the way the Dow Jones Transportation average either confirms or does not confirm the move in the Dow Industrial Average.

The second take is that although silver has been lagging gold, it is just a matter of time before silver plays ‘quick catch up’ to gold and confirms the final blow off move in gold.  This would mean that the price of silver must get an extraordinary rally going in the next year to the 50 dollar range and even beyond that level.  Why? Because the price of gold is already trading at lifetime highs and has already exceeded the old 1980 price high of 850 to 900.  Silver’s high in 1980 was in the 40 to 50 dollar range and so in order for silver to catch up to the gold price it needs to get near those record levels.

This will take some time though assuming I am correct with the ‘second take’.  But it is also important to keep in mind that in many later stages of commodity bull markets 90% of the move can happen in the last 10% of the time.

Read more

Another Long Term Chart of Natural Gas

sc 

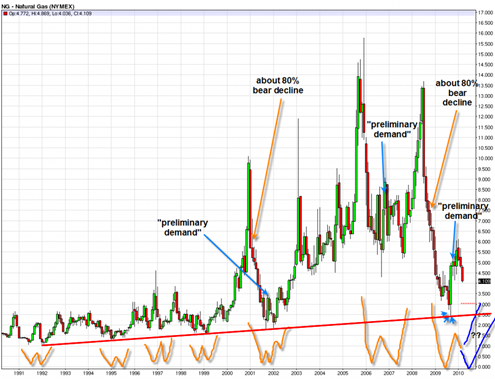
This chart was sent to me by ‘Michael’ and is a nice piece of chart work on on the natural gas contract so I thought I would repost it here and let it basically speak for itself.

When I look at this chart it has me thinking that the bottom in Natural Gas may be sooner than I realize because when I look at the pattern of 2009 and 2010 and then compare it to the pattern of 2001 and 2002, one could make the argument that we have ALREADY made a W Bottom and now we are simple making a similar ‘handle’ as we saw in the 2002 time period.

Also significant is that we are right now near the 61.8 fibonnaci retracement level near the 4 range.  That 61.8 fibo level may provide some significant support to the natural gas contract as we close out the month of March.

Read more