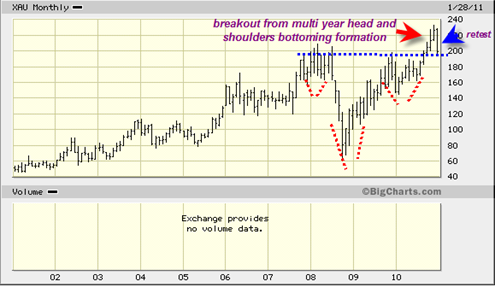
Gold is a Great Trend Buy Right Now

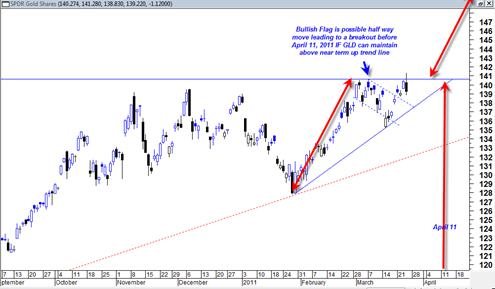
Today the Gold price finally got the job done.  The GLD was flirting with new all time highs for a whole month and teasing both the bears and the bulls.  With today’s very clear sign of strength, the GLD ETF and the DGP ETF is a very clear trend buy right now for more upside in the months ahead.  This is about as low a risk trend buy as you will see in any market.  Day’s like today are the kinds of days traders wait a long time for.  They provide very little doubt about what the next trend will be and are a huge clue and ‘cheat sheet’ for traders.

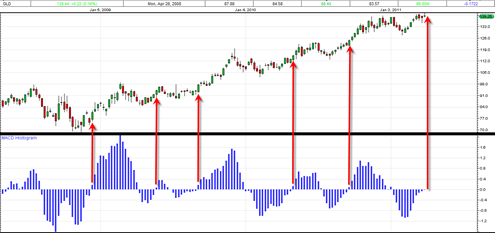
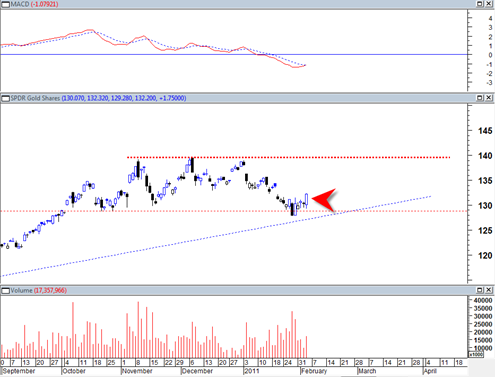
Before today, I think still one could have made some bearish arguments for gold, but today’s move decisively puts the daily MACD and the WEEKLY MACD in buy trend mode and I expect plenty of upside from here.

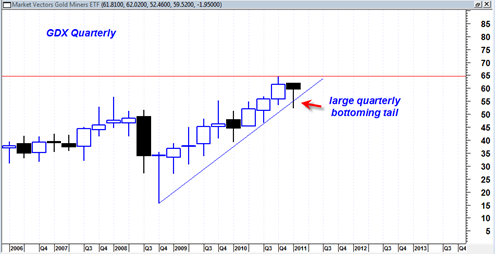
Pretty much the same can be said of the GDX mining ETF.

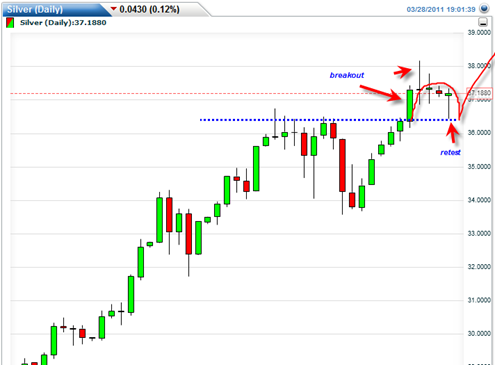
BestOnlineTrades.com has been talking about how Silver has been leading the markets to new all time highs, then gold was in second place and the Russell 2000 third and the sp500 maybe last.  Silver continues to move higher after the successful very low volume retest about a week ago.  This was a key sign that the silver market was not ready to fall apart despite all the top picking attempts.

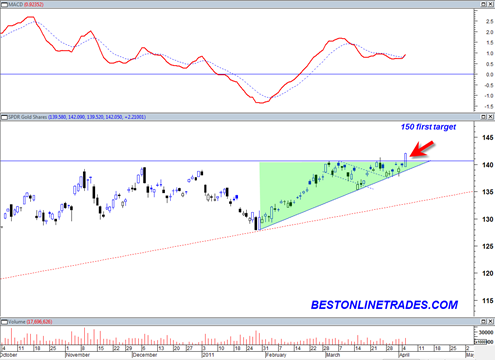
I really hate to overplay the ‘Marty Armstrong June 13, 2011’ 8.6 year turning point but once again I find myself thinking about this key date as we see the gold price blast higher today to a new life time high breakout.

Read more

Is the SLV ETF Still a Good Long From Here

A comment poster wrote me and asked me if I thought the SLV ETF was a good long from the 37 level.  My response would be that one should be keenly aware that the SLV has already made a huge move from early February 2011 up until the present time frame.  Early February 2011 was the ‘easy buy’.

Now the SLV is in a more mature advance stage and I think if one is going to go long from here it should be more a shorter term swing trade long position with a tightly controlled stop.

Why? Because even though momentum still looks quite strong, the chances for more technical selling coming in more heavily are more likely during this stage.  So if one gets too complacent, there is the risk of getting caught in a big profit taking wave.

So, I would say that if I were to go long the SLV from here I would try to do it from 37 or slightly under and then set a protective stop loss at 35.70.  That would put the stop loss right under the recent break out area.  Assuming an entry at 37 and then assuming the stop loss gets hit the same day or next day it would equate to a loss of 3.51%.

Read more

Silver Futures Do Retest of Key Short Term Support

Silver Futures seem to have managed a successful Wyckoff Retest of the near term and short term support range of 36.43.  Today they printed a hammer reversal and the low of the hammer was the break out level of 36.43.

In the short term I think it is important to hold 36.43, or the low of today’s hammer as validation that this was a successful retest.  Then it could allow the uptrend to resume, perhaps later this week.

In the case of the SLV silver ETF the support range comes in at 35.60.  I should say that there is a small bearish triple P pattern on the daily MACD histogram of the SLV right now.  This is still unconfirmed and would be confirmed on a close below today’s low in the SLV either tomorrow or later this week.

It still seems as though SLV is not finished with this run yet.  I still think there is upside to 40 range at some point and maybe even to 50.  Ideally tomorrow, the SLV will have an ‘up day’ and put the MACD histogram in a new potential bullish stance with possible follow on confirmation either Wednesday or later in the week.  It will be quite interesting given how many top calls there have been lately.  But sometimes top callers are right…

Read more

Can Gold Break Out to a New Life Time High Next Week

I just reviewed the weekly GLD gold price chart versus the MACD histogram and I think I have to come to the conclusion that there is a pretty good chance that next week is the upside weekly break out week for the GLD to new life time highs.

The nice thing about weekly charts is that they tend to smooth out all the noise.  In particular I am focusing on the point at which the weekly MACD histogram transfers from the negative to the positive (from under the zero line to above the zero line).  Every single time since early 2008, this occurrence in the GLD has led to and up week.

Now we see that the weekly MACD histogram is in a similar stance where it looks like it is just inches from transferring from under the zero line to above the zero line.  If the past is any guide, then we should see the GLD finish next week strongly higher in the form of an up weekly closes.  I cannot speak to the magnitude of the move, but it seems one can say with a reasonable degree of confidence that it should be an up move. 

Since the GLD is already so close to trading at new life time highs, I think it can be said that new life time highs should be able to be achieved as well…

Read more

Mining Stock Boom Coming Soon

There has been a lot of ‘chatter’ lately about how the gold price may be at a major top.  I keep looking at the GLD price chart since October of 2010 and have been trying to come to a bearish conclusion but am having a hard time doing so.

It is clear that the GLD has shown a struggling attempt to make new all time highs from the period October 2010 to end of year 2010.  The pattern resembles the somewhat common ‘three drives to a top’ pattern that is occasionally seen in stocks and indices.  But this topping pattern seems to have failed.  During January 2011 we saw the GLD break down, looking like it wanted to confirm the three drives to a top pattern, but then afterwards we saw the GLD take off yet again pushing into life time highs again (into early March 2011) but only for a brief period.

My take is that this most recent push into life time highs again, even though they were only marginal new lifetime highs, should not have occurred if the GLD was in a very bearish pattern.

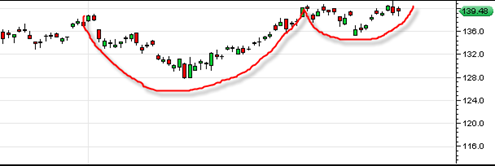
Instead the GLD now appears to have a cup and handle formation with 152 as the projected target (roughly 1520 gold price).

gld20110325

Read more

Gold Price ETF does a Teaser Life Time High Today

Today the gold price ETF and the spot gold price rallied up to life time highs but then sold off end of day to settle and close under yesterday’s low.  I have seen this type of action before on the gold price as it attempts to break out to new all time highs.

At this point I do not believe the head fake.  I think ‘they’ are trying to create the illusion that this was a reversal sell off and important rejection of the highs to be followed by another leg down.  I think if they had closed the GLD ETF down much more, perhaps 2% or more it would have made a much more dramatic statement.

Instead, we see that the GLD pushed to new life time highs and tested two important price swings in early March on equal or greater volume, a positive sign.

After hours the GLD bumped up quite a bit, moderating the potential short term bearish looking candlestick.  But again, it is only moderately bearish to me.  I think today is a head fake to sooth the gold top calling crowd.

One mental trick to use when viewing intra day price reversals like we see in the GLD today is to see how negative a close occurs relative to the previous day’s candlestick.   In some cases one can see a strong intra day reversal and yet the close did not even manage to get under the previous day’s high.  In my experience those reversals are usually just consolidations rather than all out bearish trend changes.

Read more

A Mega 10 to 15 year Bull Market in Commodities

I was contemplating a little bit the MACD of the monthly inflation rate chart I posted a few days ago this past weekend and it occurred to me after reflecting on the yearly portion of that chart that we have not really even begun the commodity bull market.  If you look carefully at the yearly … Read more