SKY MOBI a Potential Huge China Growth Stock

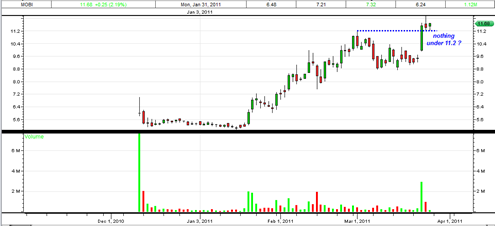
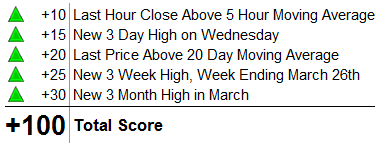
I really like the potential of MOBI, a Chinese Growth Stock and an IPO as of 12/10/10.  I found out about MOBI through MarketClub’s Powerful Chart Analysis and Smart Scan Tool.  Some Chinese stocks have taken big beatings in late 2010 and early 2011 as there have been some issues with their accounting and business practices (ie. CAGR).  However I do not think this is a reason to paint all Chinese stocks with the same brush stroke.

MOBI is in the mobile applications space which is currently a very high growth area.  The mobile internet applications market is a great growth sector and probably even more so in China.

The Sky Mobi investor section of their website describes their business as:

Sky-mobi Limited (Nasdaq:MOBI), operates the leading mobile application store in China. We work with handset companies to pre-install our Maopao mobile application store on handsets and with content developers to provide users with high quality applications and content titles. From January 1, 2007 to September 30, 2010, Maopao had approximately 479 million cumulative users. Over the same period, we offered over 770 applications and over 61,000 content titles and the cumulative number of downloads reached 3.6 billion.

MOBI has a very small float in the 7 million share range.  This means that this stock can move very fast and since it is an IPO there is no previous resistance in terms of the price trend.

I really think MOBI has a good shot at getting to 20 dollars close to double the current price range.  This stock has the growth, the market and the sector that are very favorable.

Read more

China Automotive Systems Inc CAAS Still in a Long Consolidation

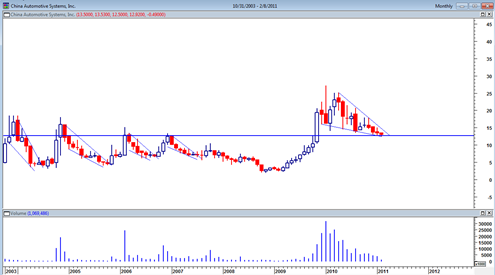
China Automotive Systems is an automotive parts supplier and according to their website is the leading supplier with 15% market share.  They may be a leading supplier of automotive steering systems and other parts, but this market is also quite fragmented.  Still China is well on its way to becoming and continuing to be the … Read more

China Agritech Inc May be a Very Good Position Trade Going Forward

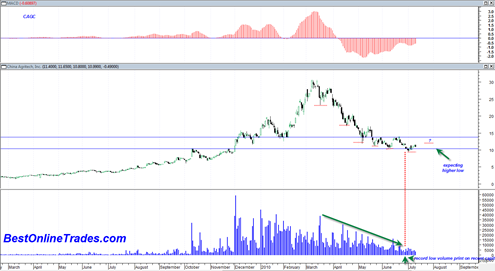
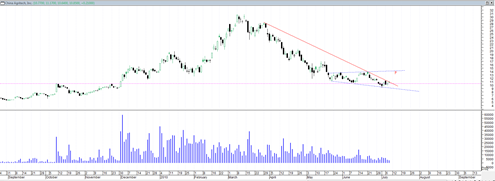
I posted before briefly on CAGC China Agritech Inc as having a good possibility of moving higher to the top of its inverted triangle pattern.  But after looking at the longer term chart and evaluating the risk reward I think I have to conclude at this point that CAGC is a good position trade from … Read more

China Agritech Inc Pulls back to the bottom of the broadening wedge formation

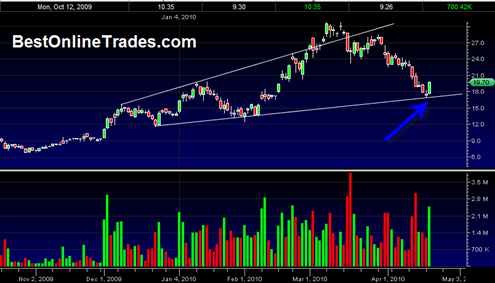
China Agritech Inc CAGC has pulled back all the way to the bottom of its broadening wedge formation and it did it a lot sooner than I thought it would.  I indicated in a previous post that China Agritech has a habit of being just as volatile on the downside as to the upside.

CAGC was way overdue for some type of pullback given its recent 130% super move in just a month and a half to the upside.  Then some insiders started selling and I believe gross margins started to slip a little bit and so people started dumping shares.  It is probably a true statement to say that when any company gets near a 500 million dollar market cap it enters a new juncture where it must prove itself and show that it is ready to enter mid cap land and be able to continue to sustain growth despite the competition.

I don’t know whether this will be the case.  But I do know that CAGC has touched the falling wedge support and so far today has shown a nice price reaction off of this support.  The recent two candlestick bars also appeared to be a morning star candlestick pattern which is a reversal pattern.

Read more

Another Quick look at CAGC China Agritech Inc.

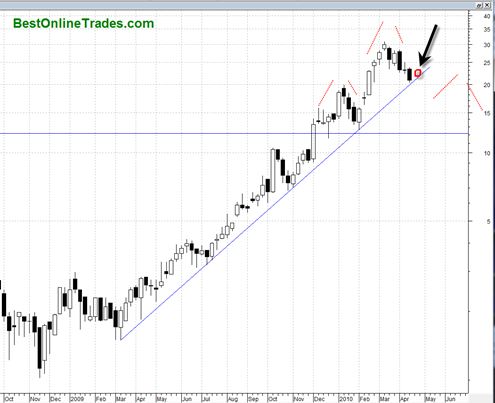
I already talked about China Agritech Inc. yesterday.  But I wanted to post this semi-log chart which more clearly shows the juncture this stock is at right now.  It did break down today and pushed the RSI below historically supportive levels which is a concern.

Also, based on the chart below there is at least the potential for a head and shoulders topping pattern that could be forming.  The pattern can fail as well, but if it is a valid pattern then China Agritech should break down within the next week and a half time span.

If the pattern is not valid then the failure should also be indicated within the next 1 and a half weeks.  The best bullish scenario is for CAGC to hold above 20 by the end of this week and then hold 21 by the end of next week (the red square drawn on the chart below).

If after the end of next week price is still drifting around the 20 range then this entire uptrend is in serious doubt in my opinion.

Read more

China Agritech Inc at a Moment of Truth

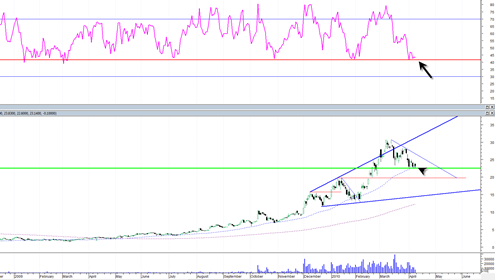
China Agritech Inc. is right now from a technical analysis standpoint at a moment of truth in my opinion.  CAGC in the past has consistently held the support of its 50 day moving average and also the 42 RSI level (Relative Strength Index).

The 42 RSI level has repeatedly served as a base for this stock going all the way back to the start of 2009.  This means that we should expect the 42 RSI level to hold for China Agritech Inc. to keep its longer term bull run intact. 

If the 42 RSI level does not hold then what it says to me is that the longer term ‘easy’ uptrend is broken and CAGC may go into a more complex longer duration correction.

In the short term the stock is suffering from a small descending triangle formation.  These formations can lead to a break down in price but they also have a habit of failing quite often as well.  So if we do get a breakdown out of the small triangle and move below the 42 RSI level then it would seem more corrective action is on its way.

Previously I had drawn a large broadening wedge type pattern on CAGC and if the pattern is accurate then it suggests there is at least the possibility of CAGC going back down to the bottom of the wedge eventually near the 17 level.  That may seem like an unusually large move, but this stock is famous for swinging high but just as easily swinging low when money gets scared.  The float is small and the volatility is high.

Anyway here is the chart I have for CAGC which shows the broadening wedge as well as the critical 42 RSI level indicated by the solid red horizontal line in the indicator portion of the chart.

Read more