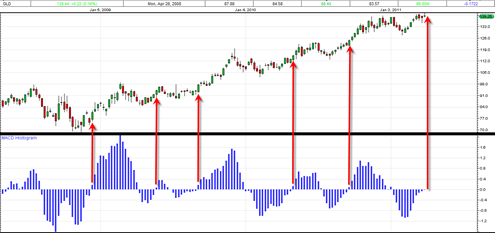
I just reviewed the weekly GLD gold price chart versus the MACD histogram and I think I have to come to the conclusion that there is a pretty good chance that next week is the upside weekly break out week for the GLD to new life time highs.
The nice thing about weekly charts is that they tend to smooth out all the noise. In particular I am focusing on the point at which the weekly MACD histogram transfers from the negative to the positive (from under the zero line to above the zero line). Every single time since early 2008, this occurrence in the GLD has led to and up week.
Now we see that the weekly MACD histogram is in a similar stance where it looks like it is just inches from transferring from under the zero line to above the zero line. If the past is any guide, then we should see the GLD finish next week strongly higher in the form of an up weekly closes. I cannot speak to the magnitude of the move, but it seems one can say with a reasonable degree of confidence that it should be an up move.
Since the GLD is already so close to trading at new life time highs, I think it can be said that new life time highs should be able to be achieved as well…
Certainly a lot of interesting markets to ponder next week, the last trading week of March, and last trading week of the quarter…
Silver leading the way already to new highs, gold not far behind, the Russell 2000 not far behind and the sp500 in last place. Its seems like there is a little inflationary race we have going on here.. lets see who wins.. 🙂

