I am fully short the SPY as of mid day today again after going flat near the peak of yesterday’s bounce. I was too heavily short going into the 2 day upwards bounce the last two days and it really caused me to get a major case of whiplash. Note to self: Next time scale into a position much slower than normal especially in an already whipsaw trading range type environment.
I apologize for the recent whipsaw nature of some of my postings, but I have been having a bit of a hard time adjusting to the recent volatility and difficult trading range.
It appears as thought this will be the norm the next few weeks where a huge move down leads to a huge move up and vice versa.
Key action today in the SPY was the fact that the SPY closed under the key 184 support range. This 184 support range is really critical because a break below it means it then turns into resistance, and the ability of the market to break back up and through this 184 resistance is quite remote in my opinion, at least not anytime soon.
We closed marginally under the 184 today but honestly need a full price bar under the 184 level to seal the bearish deal.
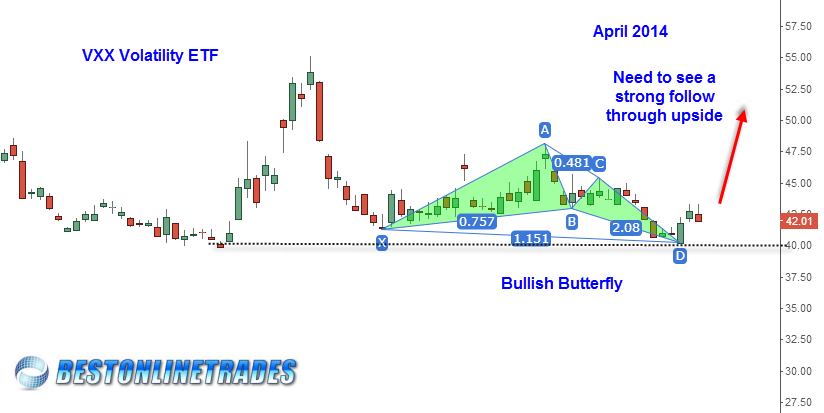
The VXX volatility ETF seems to be reacting favorably to the bullish butterfly identified a few days ago. Today saw another strong reaction up from this pattern which seems to be confirming its bullish signal.
 VXX (VIX) ETF Bullish Butterfly Pattern
Looking ahead a bit, I am of the mind right now that one of two things will happen first.
- We reach the key date of April 21st 2014
- We reach 174 on the SPY which matches the crucial key swing low of February 3, 2014
April 21st is only 7 trading days away. If 174 is hit much sooner than expected (ie. a few trading days) then it would seem to open the door to a northward reaction rally occurring from 174 only to be followed by the real ultimate decline into April 21st. However if 174 approached in a much more cumbersome manner (lots of minor upside counter trend rallies), then obviously reaching 174 is going to take some time and maybe it would not occur until on or after April 21st, 2014. That is the market dynamic I am currently considering.
Finally, I would like to point out that during the lead up to the 1987 stock market crash from June to September 1987 (roughly 3.5 months) the sp500 broke up and through a key resistance line on the second attempt, moved to new all time highs, then a sell off began which led to a double bottom retest of this support line, then rallied once more and then finally tested it a third time only to break under it and crash.
The present time frame sees a similar roughly 3.5 month pre cursor rally, a double attempt to break up and through resistance, and then a move to new all time highs. Then a double bottom retest and then one more move to new all time highs and then the final retest of support which is then broken.
I am not suggesting that the price action is the same in the 1987 and 2014 time frames, but I am suggesting that the sequence of steps towards the break down is quite similar. Not only that but the number of times it was tested either as resistance or support. Also, the key support line is absolutely crucial in both cases.
 2014 SPY 1987 sp500 Crash Comparison
I will let you be the judge on the similarity characteristics. It is clear on the chart how the horizontal dotted line turns into resistance two times, then support 3 times, but the third time it transfers to resistance again after a minor 1 to 2 day bounce.
I am not predicting a 1987 style situation the next 7 trading days, but I will say that if it were to happen similar to the way it occurred in 1987 then tomorrow April 11th, 2014 we should see another maribuzu candlestick price bar which is essentially a large rectangle and shows a closing price at or very near the low of the day. Then another one should occur after that also closing at the lows and with a wider range, and then a final one that is a maribuzu bar 5 times the size of the first few maribuzus and also still closes on the low of the day. The odds seem astronomically against such a thing happening again, especially since we have already seen the nasdaq and sp500 trade more in rotational fashion with waterfall upside reactions and then resumptions down… but I am just saying if a 1987 is going to happen again, watch for this large rectangle type candlesticks that incrementally increase in size.
