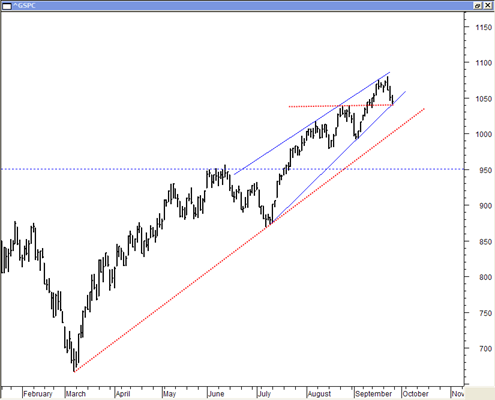
I would have to describe the decline so far in the SP500 as ‘labored’. I am not seeing panic or a total loss of price support at this point, instead just a slow and steady profit taking move. The chart in this post shows that the SP500 is at the close of Friday sitting right on the steep blue uptrendline support and also at the minor horizontal support as defined by the red horizontal dotted line.
I am thinking that whatever type of decline we get in the weeks ahead may not be rapid or involve very large one day percentage moves like we saw during the 2008 period. The reason for this is that we are just now coming off of an extremely overbought market and slowly transitioning to a mini bear leg. We are still trading above key moving averages and still to large degree the bulls are in control. That is the mindset I am trying to keep right now because I don’t want to be too aggressive on the short side.
I have a feeling that the coming decline in prices is going to be slow, labored and to be honest somewhat boring, especially when compared against the 2008 extremely rapid price declines.
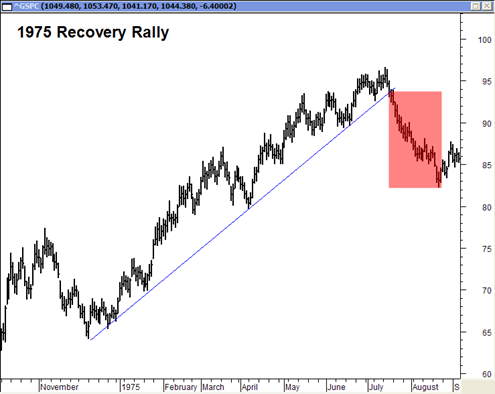
A few other times in the past I have written about the similarities to this bounce in the market to the 1974 bounce. They are not a mirror image but there are enough similarities that it is worth studying for possible clues about how a decline may look in the weeks ahead.
The chart above is the mega bounce that occurred in the 1975 period after the devastating bear market plunge of 1974. Similar to the current period you can see that the price pattern somewhat resembles a rising wedge (not drawn) and that price kept on pushing higher and higher after only minor intermittent declines.
When the ‘real correction’ did finally start in July 1975 (the red shaded box) you can see that it was a persistent price decline but it was nowhere near the devastating total loss of price support that occurred in the 2008 period. The decline in 1975 was just a slow steady decline and all the price destruction that occurred in this red shaded box marked the worst of the entire decline. The price action after this red shaded box was just sideways retests and slow base building.
So it has me thinking we will probably get our decline in October 2009 but it may be labored, slow and somewhat persistent but not exciting. No 500 to 700 point down days this time.. instead a series of 80 point down days on the DJIA that spread out over a whole month.


