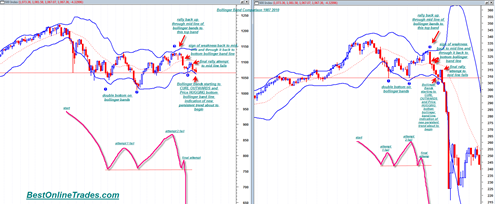
Here is the Bollinger Band comparison chart between the time periods 1987 and 2010. The time similarity does not exist whatsoever. I am only trying to identify the overall pattern similarity irrespective of time.
The chart below pretty much does the talking. The market in both time frames does a double bottom on the lower Bollinger Band line and then goes up and through the mid line for a final rally attempt which fails at the top Bollinger Band line. Then a big sign of price weakness breaks the market back through the red dotted mid line again and price finds short term support at the bottom Bollinger band line in the form of reversal hammers.
Then one last very minor rally attempt is done back towards the mid dotted line but that fails and leads to a very sharp decline that is indicated by price hugging the bottom Bollinger Band line.
The expansion (curling outward) of the Bollinger Band lines begins to occur right now in the 2010 time frame and is an indication of a volatility expansion that is about to start. Of course we already know the volatility expansion that occurred in 1987. Whether or not we get the same degree of volatility expansion now remains to be seen. . .


It is interesting how timid we tech folks are. We hedge our projections with “it seems”, or “most likely”, or “probably” where the fundamental shills of Wall Street say “NO DOUBLE DIP” or now is the “TIME TO BUY” the market is “fundamentally bullish”.
I am sick of these prostitutes!
I have been studying technical analysis for decades.l Took up Elliot Wave when Precter won a big National contest in the early eighties. Dito for McClain Oscillator when Gambage was on KWHY in Los Angeles.
OK, so here it is I have never seen such bearish technical indicators, ever.
This market is headed down in a BIG WAY!
So there TV shills. Here is one of their recent comments (Aug 24):
Why Markets Will Avoid Double-Dip:
“With stocks lower for the fourth trading session, are we headed for a double-dip? David Kelly, chief market strategist at JPMorgan Funds, and Sandy Lincoln, investment strategist at M&I Investment Management, shared their insights.
“We’ve got a very soft economy—it’s a constant disappointment, but we don’t think we’re going to have a double-dip because the most cyclical sectors of the economy are already in the basement,” Kelly told CNBC.
“To get a double-dip recession, we need those cyclical sectors to roll over—I don’t know where they’re going to roll over to,” he continued.
In the meantime, Lincoln said the micro-developments are presenting a “very compelling case” in the markets and investors should look to buy individual stocks.
“The key ingredient is what companies have been doing over the last several years,” he said.
“They’ve been cutting costs, they’ve been prudently investing in their core businesses, they’ve been generating a lot of cash flow, they’ve got experienced managements in these companies and so if you look at the bottom-up company by company, you come to a conclusion that these macro-concerns begin to dissipate.”
Imagine these guys are making hundreds of millions of dollars peddling their propaganda!
They belong in prison!