Sometimes things are not as they appear to be. Here is a short piece of BestOnlineTrades Trivia for you. Within the next 30 minutes I will post a follow on post explaining why this trivia question is potentially important.
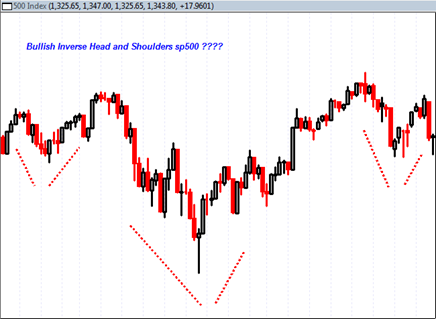
The trivia question is: The chart below represents sp500 price action that takes the form of a bullish inverse head and shoulders pattern. What period of time in the sp500 does it reflect?
The price action shows an important period of the sp500 trading where we see a clear inverse head and shoulders bottoming pattern. But during what period of market history did this occur ?
I will reveal the answer 30 minutes from now along with some follow on discussion.
The chart is daily price bars and shows the bullish inverse head and shoulders pattern.

