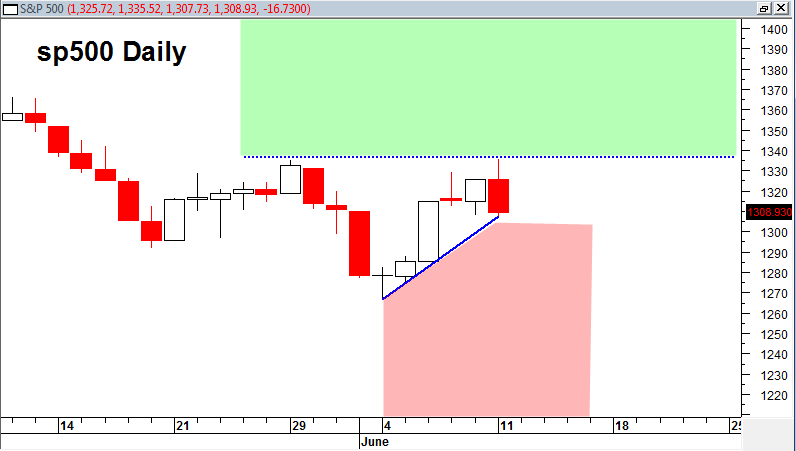
The action today in the indices was not exactly bullish looking on a short term basis. This looked like bearish engulfing today on most indices. However volume was quite light, but typical for a Monday this time of year.
The short term bearish engulfing action today ended up closing right near a short term uptrend line. This one day action today could start to evolve into something much more bearish with a lower close tomorrow and a close that is lower than the previous two trading days. If that occurs then it would confirm the bearish engulfing candlestick formation we have potentially in force today.

The short term trend line in the chart above I view as rather important in the near term. Closing under it and into the red shaded area puts the market at risk for a negative closing week this week. On the other hand closing higher tomorrow and negating today’s bearish engulfing would keep the market in a more positive bias this week.
The oil ETF (USO) closing at new lows does not really help the bull case.
The US Dollar index is still showing strength and the TLT still has a constructive supportive structure to trade higher off of..
So what does this all mean ?
My previous post sounded optimistic on the longer term potential quarterly chart setup. The problem is we are trading right NOW in the middle of the last month that makes up the end of the second quarter price candlestick. It will be a price candlestick of significant importance and will carry important weight on the monthly and quarterly scale. The final conclusion about the markets longer term prospect (monthly and quarterly) weighs very heavily on how we close this month and second quarter. The chart above shows the dynamic that will lead into an eventual closing monthly and quarterly close. So again, a close into the red shaded area is not going to be good for my optimistic scenario described in my previous post. Price closings into the green shaded area will support the longer term optimistic scenario.
So another 14 trading days for a much more resolute decision and a few more trading days into this week as strong hints on the next key market direction…
I have seen plenty of very potentially bearish engulfing candlesticks over the years on individual stocks and on market indices. Sometimes they are fakes and flukes. A lot of the time what I have seen is that the immediate next days price action is the kicker that determines if it was for real.
So I would say watch tomorrows price action closely for signs of weakness. Watch the holding of the short term blue trendline or not. A break of the trend line on a closing basis could be the signal that says we are about to tilt towards a weaker closing June and new short bias and leg down. A constructive close, doji or holding of blue trend line would be a positive signal.
The 5/29/2012 price swing was tested on the SPY today with higher volume. So on a short term basis that could suggest we should go test today’s high again.
But ultimately price close tomorrow will be very telling as to the near term and then end of month intentions of the market.
P.S. Today’s topping tail was once again created right near the 38% Fibonacci retracement zone. It would be quite bearish if we are not able to break above this minimum 38% retracement zone which is near the horizontal dotted blue line.
